


2024.11.21
This article was :
published
updated
Recap of previous trading day (November 20)
Yesterday the USDJPY began rising from its low of 154.52 directly after the open. Around GMT 12:00, the price hit a high of 155.88. After GMT 14:00, it began to decline but did not fall below 155, and trading for the day closed at 155.38.
Recap of the Tokyo market and outlook going forward
Today the USDJPY moved down directly after the open, marking a low of 154.87 around GMT 02:00. As of GMT 04:00, it is trading in a narrow range around 155.00.
Looking at the 1-hour chart of the USDJPY (as of GMT 03:30 on November 21), the candlesticks are moving below the middle line near the -2 standard deviations level. The downward trend appears likely to continue on this timeframe.
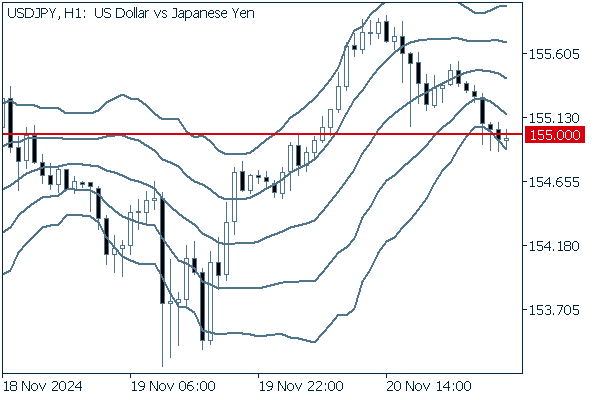
(20-period Bollinger Band, showing ±1 and ±2 standard deviations)
Today's main economic indicators are as follows.
- GMT 13:30 U.S. November Philadelphia Fed Manufacturing Index
- GMT 13:30 U.S. Initial jobless claims for the previous week
- GMT 13:30 U.S. Continuing jobless claims for the previous week
- GMT 15:00 U.S. October Leading Index
- GMT 15:00 U.S. October Existing home sales
Was this article helpful?
0 out of 0 people found this article helpful.
Thank you for your feedback.
Send