


2024.11.20
This article was :
published
updated
Recap of previous trading day (November 19)
Yesterday the USDJPY's decline that began directly after the open paused around GMT 03:00, then began rising again, but reports of President Putin loosening nuclear weapons use criteria and missile attacks from Ukraine caused a sharp drop around GMT 08:30, hitting a low of 153.27 yen. Around GMT 13:30, the USDJPY began rising and trading for the day closed at 154.65 yen.
Recap of the Tokyo market and outlook going forward
As a so-called "5/10 day" (a date ending in "5" or on a multiple of "10" on which Japanese companies often settle foreign exchange payments), today the USDJPY rose from its early low of 154.53 yen made directly after the open, and exceeded 155 yen after GMT 04:00.
Looking at the 1-hour chart of the USDJPY (as of GMT 04:00 on November 20), yesterday's decline has become a buying opportunity causing a rise, with candlesticks moving toward the +2 standard deviation direction. The November 18 high of 155.35 yen appears likely to be the next level traders will focus on.
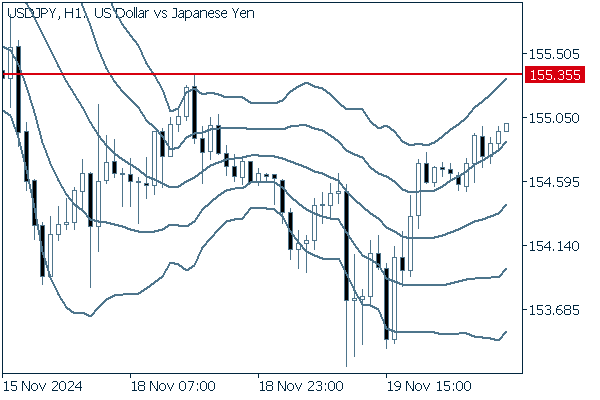
(20-period Bollinger Band, showing ±1 and ±2 standard deviations)
Today, no closely watched economic indicators are scheduled for release.
Was this article helpful?
0 out of 0 people found this article helpful.
Thank you for your feedback.
Send