


2024.10.17
This article was :
published
updated
Recap of previous trading day (October 16)
In yesterday's Tokyo session, the USDJPY price of 148.86 that was hit at around GMT 01:30 became the low, after which the market rose and subsequently traded in the lower half of the 149-yen range.
At about GMT 14:00 the USDJPY moved above the middle of the 149-yen range, reaching a high of 149.80 at around GMT 19:00, but trading for the day closed at 149.62 yen without the price having surpassed the high of the previous day.
Recap of the Tokyo market and outlook going forward
In today's Tokyo session, the USDJPY has continued the downward trend of the last phase of the previous trading day, hitting a low of 149.24 some time after GMT 02:30.
Looking at the 1-hour chart of the USDJPY (as of GMT 03:35 on October 17), the price is moving sideways in a triangle formation just below the crucial 150-yen level, forming higher lows and lower highs. The basic approach here would be to move in the direction in which the price breaks.
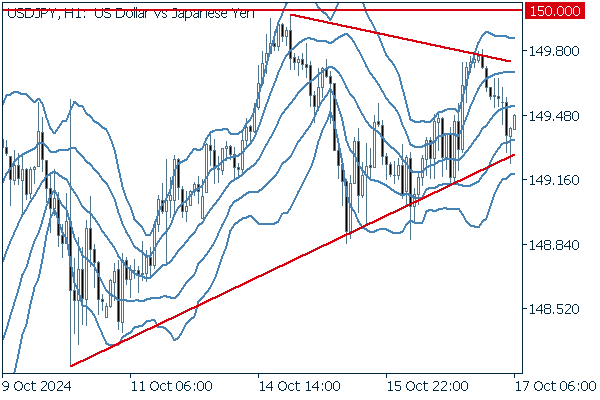
(20-period Bollinger Band, showing ±1 and ±2 standard deviations)
Today's main economic indicators are as follows.
- GMT 12:30 U.S. September Retail sales
- GMT 12:30 U.S. September Retail sales (excluding autos)
- GMT 12:30 U.S. October Philadelphia Fed Manufacturing Index
- GMT 12:30 U.S. Initial jobless claims for the previous week
- GMT 12:30 U.S. Continuing jobless claims for the previous week
- GMT 13:15 U.S. September Industrial production
- GMT 14:00 U.S. October NAHB Housing Market Index
- GMT 20:00 U.S. August Total net TIC flows
Was this article helpful?
0 out of 0 people found this article helpful.
Thank you for your feedback.
Send