


2024.10.16
This article was :
published
updated
Recap of previous trading day (October 15)
Yesterday the USDJPY reached a high of 149.83 at around GMT 23:00, but was unable to rise further as sellers of the dollar took control. During the Tokyo session the market attempted to bounce back from the middle of the 149-yen range, but shortly after GMT 09:30 the price fell below 149 yen and hit a low of 148.84.
However the decline petered out at that point, and after the New York session started the market traded in the lower half of the 149-yen range, with trading for the day ending at 149.18.
Recap of the Tokyo market and outlook going forward
Today in the first half of the Tokyo session, the USDJPY if anything trended downwards from the lower end of the 149-range, entering the 148-yen range for the time being.
Looking at the 1-hour chart of the USDJPY (as of GMT 03:45 on October 16), the second push down came to an end just after the price entered the 148-yen range. As we are seeing lower highs, we could be in a pattern where the price breaks to the downside and this trend continues for a while.
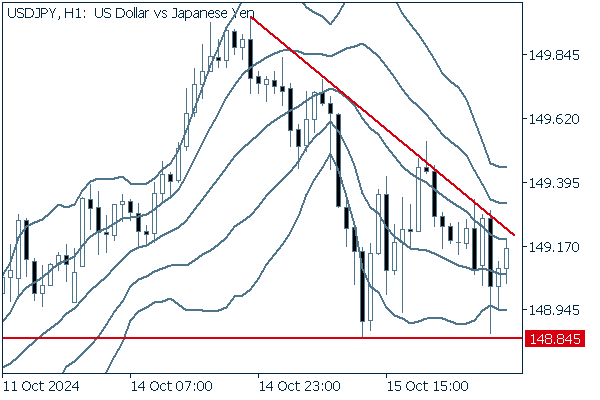
(20-period Bollinger Band, showing ±1 and ±2 standard deviations)
There are no closely watched economic indicators today.
Was this article helpful?
0 out of 0 people found this article helpful.
Thank you for your feedback.
Send