


2024.09.27
This article was :
published
updated
Recap of previous trading day (September 26)
The USDJPY was trading in the 144-yen range, testing the key 145-yen level. However, it began to decline around GMT 08:00 and hit a low of 144.11 around GMT 12:00.
The final US GDP figure for Q2, released at GMT 12:30, showed an annualized growth rate of 3.0%, in line with forecasts. The market reacted with dollar buying, pushing the USDJPY to a high of 145.21 around GMT 14:30. However, the rally paused there, and the day's trading ended at 144.80.
Recap of the Tokyo market and outlook going forward
The USDJPY followed an upward trend from the early Tokyo session, breaking through the 146 level shortly after GMT 06:00.
A look at the 1-hour chart of the USDJPY (as of GMT 06:03 on September 27) shows a sharp rise.
With the U.S. Personal Consumption Expenditures (PCE) data set to be released soon, all eyes are on whether USDJPY will close the week above 145 yen.
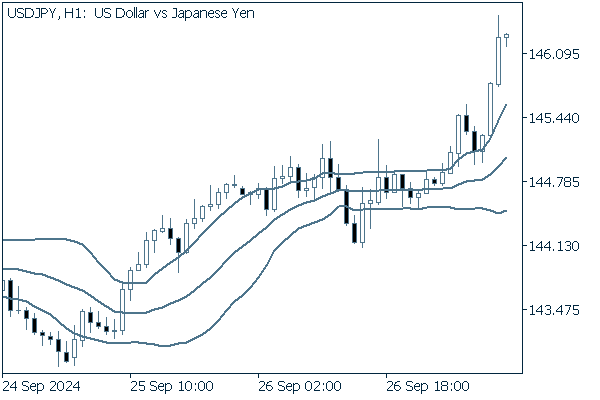
(20-period Bollinger Band, showing ±1 and ±2 standard deviations)
The main economic indicators for today are as follows:
- GMT 12:30 U.S. August Personal Income (MoM)
- GMT 12:30 U.S. August Personal Consumption Expenditures (PCE, MoM)
- GMT 12:30 U.S. August Personal Consumption Expenditures (PCE deflator, YoY)
- GMT 12:30 U.S. August Personal Consumption Expenditures (PCE core deflator, excluding food and energy, YoY)
- GMT 14:00 U.S. September Michigan Consumer Sentiment, final
Was this article helpful?
0 out of 0 people found this article helpful.
Thank you for your feedback.
Send