


2024.09.03
This article was :
published
updated
Recap of previous trading day (September 2)
Yesterday the USDJPY pulled back after peaking at 146.59 yen shortly after GMT 23:00, but then began to climb again after hitting a low of 145.77 yen not long after GMT 04:00. The rise in price stalled after reaching a high of 147.17 some time after GMT 13:15, and it closed for the day at 146.88.
The deflator showed firmness when personal consumption expenditures for the U.S. in July were announced at the end of last week. The background to this dollar-buying was the fading of expectations for a 50-basis point cut by the FOMC in September, as the view that a 25-basis point cut is more likely became more widespread.
Recap of the Tokyo market and outlook going forward
Today the USDJPY peaked at 147.20 yen just before GMT 01:00 but then fell back so that the price was trading in the lower half of the 146-yen range by GMT 06:00.
Looking at the 1-hour chart of the USDJPY (as of GMT 03:50 on September 3), the upper and lower Bollinger Bands have contracted sharply, showing that the market has lost its trend.
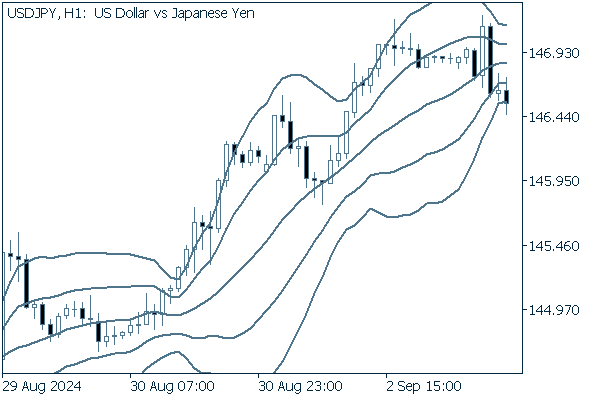
(20-period Bollinger Band, showing ±1 and ±2 standard deviations)
Today's main economic indicators are as follows.
- GMT 13:45 U.S. August Manufacturing Purchasing Managers Index (PMI, revised)
- GMT 14:00 U.S. August ISM Manufacturing PMI
Was this article helpful?
0 out of 0 people found this article helpful.
Thank you for your feedback.
Send