


2024.09.02
This article was :
published
updated
Recap of previous trading day (August 30)
On Friday of last week, trading in the USDJPY was confined to a range between the upper half of the 144-yen zone and the lower half of the 145-yen zone until about GMT 08:00, but it broke above the high of the day at around GMT 10:00 and started to trend upward.
Personal consumption expenditures for the U.S. in July were announced at GMT 12:30, with the deflator coming in as forecast at a year-on-year change of 2.5%. The core deflator was 2.6% year on year, a deterioration from the forecast of 2.7%.
As a result the dollar strengthened progressively so that by shortly after GMT 16:30 it had reached a high of 146.24 yen. It subsequently remained above the 146-yen level, closing for the day at 146.13. Due in part to traders adjusting their positions ahead of the three-day weekend arising from the U.S. market holiday on Monday, the dollar was stronger across the board.
Recap of the Tokyo market and outlook going forward
Today the USDJPY sold off after hitting a high of 146.59 at GMT 23:00, falling to a low of 145.82 not long after GMT 04:00.
Looking at the 1-hour chart of the USDJPY (as of GMT 04:50 on September 2), although the price has broken out above the sideways market that had continued for several days, it seems to have entered a phase of adjustment, as shown by the price falling below the middle line of the Bollinger Band.
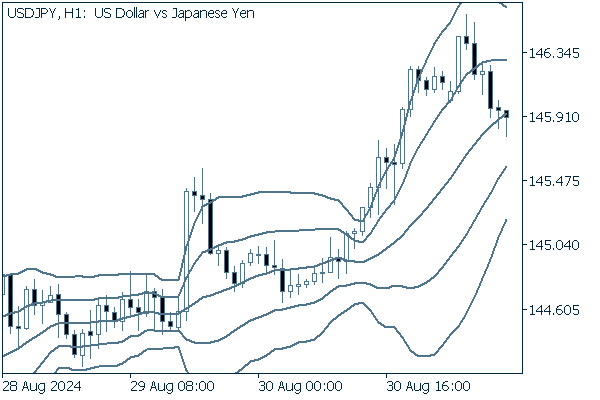
(20-period Bollinger Band, showing ±1 and ±2 standard deviations)
There are no closely watched economic indicators today.
Was this article helpful?
0 out of 0 people found this article helpful.
Thank you for your feedback.
Send