


2024.07.26
This article was :
published
updated
Recap of previous trading day (July 25)
Yesterday the USDJPY bottomed at 151.93 at some point between GMT 08:00 and GMT 09:00, formed an inverse head and shoulders, and began rising.
U.S. real gross domestic product (GDP) for Q2 (preliminary) was announced just after GMT 12:30. Against a consensus forecast of annualized growth of 2.0%, the actual figure was a robust 2.8%. In response to this the market gathered momentum after breaking above the neckline of the inverse head and shoulders, hitting a high of 154.32 some time after GMT 16:00.
Recap of the Tokyo market and outlook going forward
Today the USDJPY lacked direction in the morning, with the market confined to a price range centered on 154 yen.
Looking at the 1-hour chart of the USDJPY (as of GMT 03:25 on July 26), due to the pause in the fall in the price, the middle line of the Bollinger Bands has switched to an upward trend.
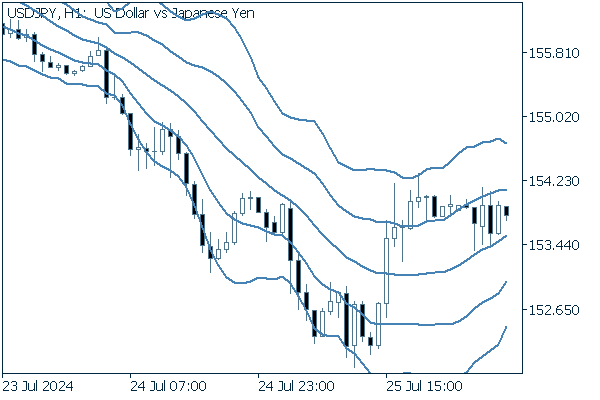
(20-period Bollinger Band, showing ±1 and ±2 standard deviations)
Today's main economic indicators are as follows.
- GMT 12:30 U.S. June Personal Income (MoM)
- GMT 12:30 U.S. June Personal Consumption Expenditures (PCE, MoM)
- GMT 12:30 U.S. June Personal Consumption Expenditures (PCE deflator, YoY)
- GMT 12:30 U.S. June Personal Consumption Expenditures (PCE core deflator, excluding food and energy, MoM)
- GMT 12:30 U.S. June Personal Consumption Expenditures (PCE core deflator, excluding food and energy, YoY)
- GMT 14:00 U.S. July Michigan Consumer Sentiment, final
Attention will be focused on personal consumption expenditures due at GMT 12:30 today.
Was this article helpful?
0 out of 0 people found this article helpful.
Thank you for your feedback.
Send