


2024.07.25
This article was :
published
updated
Recap of previous trading day (July 24)
Yesterday the USDJPY remained in a downward trend from the 155-yen range to the 153-yen range. It fell from 155.99 shortly after GMT 00:30, just below the 156-yen range, to a low of 153.10 not long before GMT 15:00.
Because there was no notable news to drive the market yesterday, this was a continuation of the existing stronger yen/weaker dollar trend.
Recap of the Tokyo market and outlook going forward
Today the USDJPY maintained its downward trend. It marked a high of 153.96 shortly after GMT 00:00, but then changed direction and began to fall, reaching a low of 152.27 just after GMT 03:00. In the blink of an eye, the market was moving back and forth in the 152-yen range.
Looking at the 1-hour chart of the USDJPY (as of GMT 04:45 on July 25), the price has more or less continued to walk along the lower band. Even when it does break above the -1 standard deviation of the Bollinger Band, it immediately comes under pressure and returns to the downward trend.
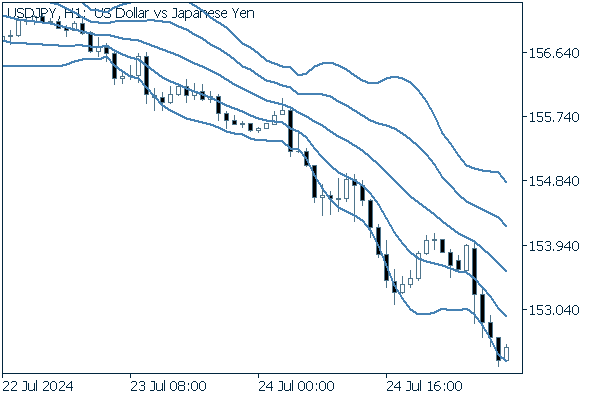
(20-period Bollinger Band, showing ±1 and ±2 standard deviations)
Today's main economic indicators are as follows.
- GMT 12:30 U.S. PCE Price Index, Q2 (preliminary)
- GMT 12:30 U.S. Core PCE Price Index, Q2 (preliminary)
- GMT 12:30 U.S. Initial jobless claims for the previous week
- GMT 12:30 U.S. Continuing jobless claims for the previous week
- GMT 12:30 U.S. June durable goods orders
- GMT 12:30 U.S. June durable goods orders excluding transportation
Was this article helpful?
0 out of 0 people found this article helpful.
Thank you for your feedback.
Send