


2024.07.23
This article was :
published
updated
Recap of previous trading day (July 22)
Yesterday the USDJPY rose in the first half of the Tokyo session, but then came off in the second half and, at around GMT 06:00, fell below the low of Friday of last week.
It continued its decline, hitting a low of 156.28 slightly before GMT 07:00. Then it rebounded, temporarily recovering to the 157-yen range at around GMT 15:30.
Recap of the Tokyo market and outlook going forward
Today the USDJPY trended downward in the morning session, hitting a low of 156.19 slightly before GMT 04:00. This was slightly below the low of the previous day.
Looking at the 1-hour chart of the USDJPY (as of GMT 05:15 on July 23), the middle line of the Bollinger Bands is falling steadily. Given that the price has dipped below the -2 standard deviation, this could be indicative of increased selling pressure.
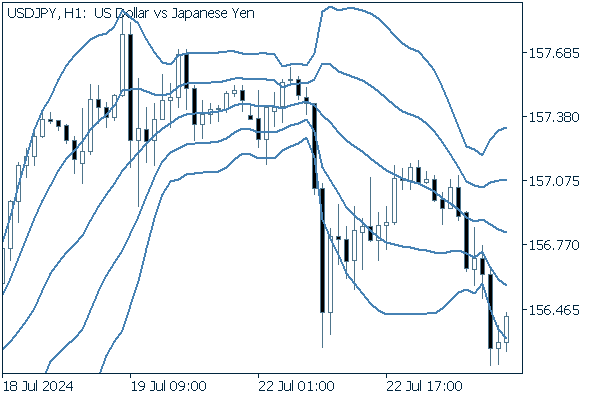
(20-period Bollinger Band, showing ±1 and ±2 standard deviations)
Today's main economic indicators are as follows.
- GMT 14:00 U.S. July Richmond Fed manufacturing index
- GMT 14:00 U.S. June Existing home sales (seasonally adjusted annual rate)
- GMT 14:00 U.S. June Existing home sales (MoM)
Was this article helpful?
0 out of 0 people found this article helpful.
Thank you for your feedback.
Send