Support information for customers, including how to open an account, how to use the trading tools, and a collection of QAs from the help desk.

Recommended for beginner!

arrow
Account Opening Account Opening Account Opening

Detailed explanation of everything from how to open a real account to the deposit process.

arrow
MetaTrader4/5 User Guide MetaTrader4/5 User Guide MetaTrader4/5 User Guide

The most detailed explanation of how to install and operate MetaTrader anywhere.

arrow
FAQ FAQ FAQ

Do you have a question? All the answers are here.

Coming Soon

arrow
Glossary Glossary Glossary

Glossary of terms related to trading and investing in general, including FX, virtual currencies and CFDs.

Features Features Features
arrow
Promotion Promotion Promotion
arrow
Partner Partner Partner
arrow
Trader's Market Trader's Market Trader's Market
arrow
bg

2024.07.22

[July 22] Sideways market has continued since Friday of last week - which way will it break?

good

This article was : 

published

updated

Recap of previous trading day (July 19)

On Friday of last week the USDJPY remained range-bound in the 157-yen zone. In the absence of events such as economic indicators or statements from influential individuals, trading for the week ended without any clear direction.

Recap of the Tokyo market and outlook going forward

The USDJPY hit a low of 157.15 shortly after GMT 23:30 on July 21, then began to rebound.

Looking at the 1-hour chart of the USDJPY (as of GMT 03:55 on July 22), the Bollinger Bands are contracting with the middle line moving almost parallel to them, showing the trendless nature of the market.

page_image page_image

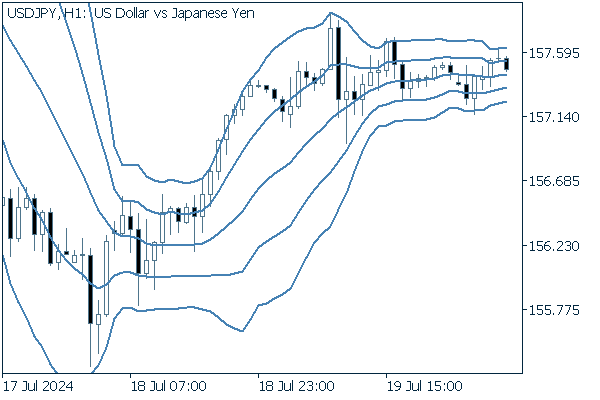
(20-period Bollinger Band, showing ±1 and ±2 standard deviations)

No closely watched economic indicators or comments by influential individuals are scheduled for today.

Was this article helpful?

thumb_down No
thumb_down Yes

0 out of 0 people found this article helpful.

Thank you for your feedback.

Send