


2024.05.14
This article was :
published
updated
Recap of previous trading day (May 13)
Yesterday the USDJPY traded in a range during the Tokyo and London sessions, but began to rise from around GMT 13:30 onward, then broke out on the upside to hit a recent high of 155.95 at about GMT 15:00.
The result of this ascent was that the USDJPY surged into the 156-yen range and ended the day's trading at 156.18 yen.
Recap of the Tokyo market and outlook going forward
Today the USDJPY broke above the high of the previous day shortly after GMT 00:00, and by GMT 04:00 it was trading in the vicinity of 156.40.
Looking at the 1-hour chart of the USDJPY (as of GMT 04:00 on May 14), yesterday's breakout has abruptly shifted the market into an upward trend, and the price is now band-walking.
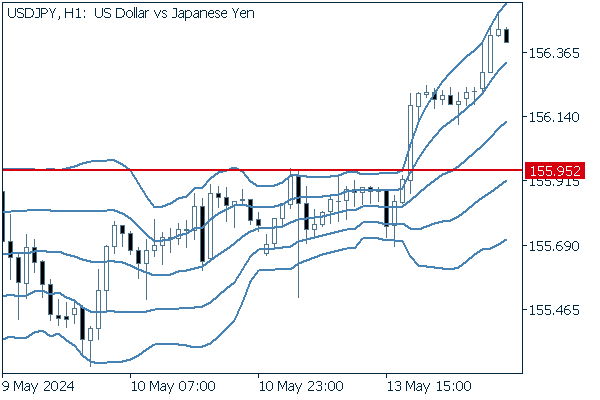
(20-period Bollinger Band, showing ±1 and ±2 standard deviations)
Today's main economic indicators are as follows.
- GMT 12:30 U.S. April Producer Price Index (PPI, MoM)
- GMT 12:30 U.S. April Producer Price Index (PPI, YoY)
- GMT 12:30 U.S. April Producer Price Index (core PPI excluding food and energy, MoM)
- GMT 12:30 U.S. April Producer Price Index (core PPI excluding food and energy, YoY)
- GMT 14:00 U.S. Statements from FRB Chairman Jerome Powell
Was this article helpful?
0 out of 0 people found this article helpful.
Thank you for your feedback.
Send