


2024.04.18
This article was :
published
updated
Recap of previous trading day (April 17)
Yesterday, price movement in the USDJPY took place around the middle of the 154-yen range during the Tokyo session and the first half of the London session.
A little way after GMT 16:00 the price fell below the previous low for the day, and some time after GMT 18:00 it touched a low of 154.15 yen.
Recap of the Tokyo market and outlook going forward
Today the USDJPY opened at 154.33. Not long after GMT 02:00 the price fell below the recent low, going down as far as 153.95, but it recovered immediately and resumed trading in the 154-yen range.
Looking at the 1-hour chart of the USDJPY (as of GMT 03:40 on April 17), it can be seen that volatility is declining and the Bollinger Bands are tightening.
Looking at the 1-hour chart of the USDJPY (as of GMT 05:20 on April 18), the price can be seen moving along and breaking below the -1 standard deviation of the Bollinger Band. Also, the price again rebounds from the 153.96-yen level of which we have become aware the past few days.
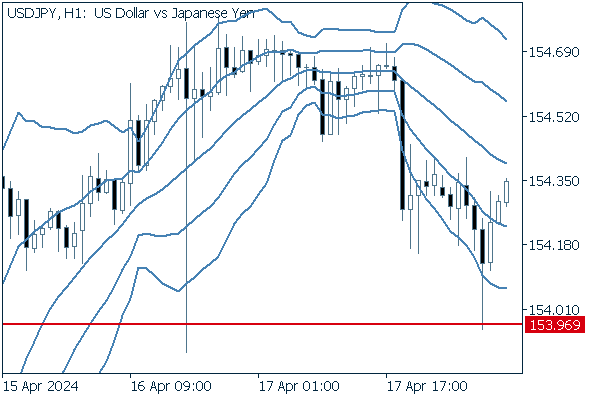
(20-period Bollinger Band, showing ±1 and ±2 standard deviations)
Today's main economic indicators are as follows.
- GMT 12:30 U.S. April Philadelphia Fed Manufacturing Index
- GMT 12:30 U.S. Initial jobless claims for the previous week
- GMT 12:30 U.S. Continuing jobless claims for the previous week
- GMT 14:00 U.S. March Leading Index (MoM)
- GMT 14:00 U.S. March Existing home sales (seasonally adjusted annual rate)
- GMT 14:00 U.S. March Existing home sales (MoM)
Was this article helpful?
0 out of 0 people found this article helpful.
Thank you for your feedback.
Send