


2024.04.15
This article was :
published
updated
Recap of previous trading day (April 12)
Last Friday the USDJPY hit a high of 153.38 just after GMT 07:00, but it started to fall after the New York session began, and at around GMT 13:00 it touched a low of 152.58 yen.
However, from there it rebounded and finished the week trading at 153.32, which was more or less the level at which it had opened earlier in the day.
Recap of the Tokyo market and outlook going forward
This week the USDJPY began trading at 153.02. The price gapped down 30 pips from Friday's close, but rose immediately to fill the gap. It then continued to rise, reaching a high of 153.74 a little while after GMT 02:30.
Looking at the 1-hour chart of the USDJPY (as of GMT 04:10 on April 15), the price is moving between the +1 and +2 standard deviation Bollinger Bands, and is beginning to walk the upper band.
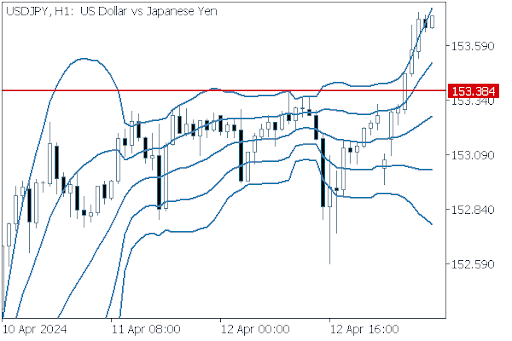
(20-period Bollinger Band, showing ±1 and ±2 standard deviations)
Today's main economic indicators are as follows.
- GMT 12:30 U.S. April NY Empire State Manufacturing Index
- GMT 12:30 U.S. March Retail sales (MoM)
- GMT 12:30 U.S. March Retail sales excluding autos (MoM)
- GMT 14:00 U.S. April NAHB Housing Market Index
Was this article helpful?
0 out of 0 people found this article helpful.
Thank you for your feedback.
Send