2024.04.11
- Features
-
Services/ProductsServices/ProductsServices/Products

Learn more about the retail trading conditions, platforms, and products available for trading that FXON offers as a currency broker.
You can't start without it.
Trading Platforms Trading Platforms Trading Platforms
Features and functionality comparison of MetaTrader 4/5, and correspondence table of each function by OS
Two account types to choose
Trading Account Types Trading Account Types Trading Account Types
Introducing FXON's Standard and Elite accounts.
close close

-
SupportSupportSupport

Support information for customers, including how to open an account, how to use the trading tools, and a collection of QAs from the help desk.
Recommended for beginner!
Account Opening Account Opening Account Opening
Detailed explanation of everything from how to open a real account to the deposit process.
MetaTrader4/5 User Guide MetaTrader4/5 User Guide MetaTrader4/5 User Guide
The most detailed explanation of how to install and operate MetaTrader anywhere.
FAQ FAQ FAQ
Do you have a question? All the answers are here.
Coming Soon
Glossary Glossary GlossaryGlossary of terms related to trading and investing in general, including FX, virtual currencies and CFDs.
News News News
Company and License Company and License Company and License
Sitemap Sitemap Sitemap
Contact Us Contact Us Contact Us
General, personal information and privacy inquiries.
close close

- Promotion
- Trader's Market
- Partner
-
close close
Learn more about the retail trading conditions, platforms, and products available for trading that FXON offers as a currency broker.
You can't start without it.
Features and functionality comparison of MetaTrader 4/5, and correspondence table of each function by OS
Two account types to choose
Introducing FXON's Standard and Elite accounts.
Support information for customers, including how to open an account, how to use the trading tools, and a collection of QAs from the help desk.
Recommended for beginner!
Detailed explanation of everything from how to open a real account to the deposit process.
The most detailed explanation of how to install and operate MetaTrader anywhere.
Do you have a question? All the answers are here.
Coming Soon
Glossary of terms related to trading and investing in general, including FX, virtual currencies and CFDs.
General, personal information and privacy inquiries.
Useful information for trading and market information is posted here. You can also view trader-to-trader trading performance portfolios.
Find a trading buddy!
Share trading results among traders. Share operational results and trading methods.
- Legal Documents TOP
- Client Agreement
- Risk Disclosure and Warning Notice
- Order and Execution Policy
- Complaints Procedure Policy
- AML/CFT and KYC Policy
- Privacy Policy
- eKYC Usage Policy
- Cookies Policy
- Website Access and Usage Policy
- Introducer Agreement
- Business Partner Agreement
- VPS Service Terms and Condition

This article was :
published
updated
Recap of previous trading day (April 10)
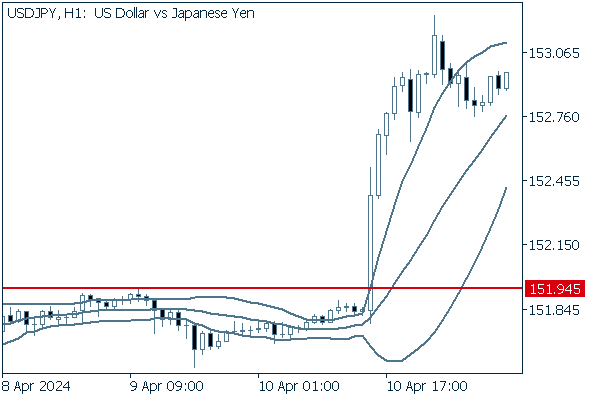
There was a major market move in the USDJPY yesterday, with the price bursting through 153 yen following the announcement of the U.S. Consumer Price Index (CPI) for March at GMT 12:30, which beat expectations. Ultimately, the high for the day was the 153.24 recorded just before the close.
Against a forecast month-on-month change of 0.3% the CPI came in at 0.4%, and in year-on-year terms it hit 3.5% against a forecast of 3.4%, in both cases exceeding market expectations. The Core CPI figure also came in higher than projections.
These CPI results again confirm the ongoing strength of inflationary pressure, and have significantly dampened expectations for interest rate cuts. According to FedWatch, it is almost certain that interest rates will be left unchanged in May. The probability of rates not being changed in June has soared from 37.7% a week ago to 81.4%.
Recap of the Tokyo market and outlook going forward
So far today the USDJPY has traded in the upper end of the 152 range after breaking below 153 yen directly after trading began.
Looking at the 1-hour chart of the USDJPY (as of GMT 04:20 on April 11), one can see that not only has the price surged past the previous high but also that the width of the Bollinger Bands has expanded dramatically.


(20-period Bollinger Band, showing ±1 and ±2 standard deviations)
Today's main economic indicators are as follows.
- 12:30 U.S. March Producer Price Index (PPI, MoM)
- 12:30 U.S. March Producer Price Index (PPI, YoY)
- 12:30 U.S. March Producer Price Index (core PPI excluding food and energy, MoM)
- 12:30 U.S. March Producer Price Index (core PPI excluding food and energy, YoY)
- 12:30 U.S. Initial jobless claims for the previous week
- 12:30 U.S. Continuing jobless claims for the previous week
Was this article helpful?
0 out of 0 people found this article helpful.
Thank you for your feedback.
FXON uses cookies to enhance the functionality of the website and your experience on it. This website may also use cookies from third parties (advertisers, log analyzers, etc.) for the purpose of tracking your activities. Cookie Policy
