


2024.04.10
This article was :
published
updated
Recap of previous trading day (April 9)
Yesterday, the USDJPY hit a high of 151.91 after GMT 07:00, then began falling back, marking a low of 151.57 after GMT 14:30.
On the chart it looks like a significant fall in the price. However, the difference between high and low is only a little more than 30 pips, and it actually shows that volatility is declining.
Recap of the Tokyo market and outlook going forward
Today the USDJPY opened at 151.74, but although it had hit a high of 151.80 as of GMT 05:00, volatility remained low.
Looking at 1-hour chart of the USDJPY (as of GMT 05:15 on April 10), the price has rebounded slightly from the lower 2-standard deviation Bollinger Band.
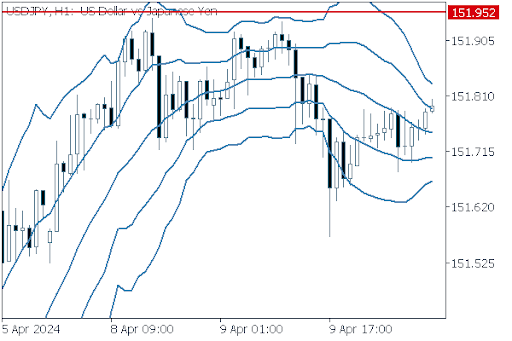
(20-period Bollinger Band, showing +1 SD, +2 SD)
Today's main economic indicators are as follows.
- 12:30 U.S. March Consumer Price Index (CPI, MoM)
- 12:30 U.S. March Consumer Price Index (CPI, YoY)
- 12:30 U.S. March Consumer Price Index (Core CPI, MoM)
- 12:30 U.S. March Consumer Price Index (Core CPI, YoY)
- 18:00 U.S. March Monthly Budget Statement
- 18:00 U.S. Federal Open Market Committee (FOMC) Meeting Minutes
The key event will be the CPI at GMT 12:30. If it reveals signs of inflation retreating, it will open the way to an earlier cut in interest rates.
Was this article helpful?
0 out of 0 people found this article helpful.
Thank you for your feedback.
Send