


2025.05.19
This article was :
published
updated
Weekly FX Market Review and Key Points for the Week Ahead
In the foreign exchange market for the week that ended on May 17th, the USDJPY fluctuated in a volatile fashion. The agreement between the U.S. and China to roll back tariffs led to a sharp rise in the pair from the 145 yen range to the upper 148 yen range. However, it then fell to the 144 yen range amid concerns that the agreement is only valid for 90 days and that the U.S. is pressuring Asian countries to correct their currency policy.
May 12 (Mon)
The USDJPY started the weekly trading session with an upward gap. After U.S. Treasury Secretary Scott Bessent said that the U.S.-China trade talks had made progress, the pair jumped to 148.65 yen, gaining about three yen in one day.
In contrast, both the EURUSD and the GBPUSD plummeted. The former reached the 1.106 range, and the latter fell to the 1.313 range.
May 13 (Tue)
Profit-taking selling after the previous day's sharp rise pushed the USDJPY down to 147.3 yen. Meanwhile, the EURUSD rebounded to the 1.119 range, and the GBPUSD climbed to the 1.331 range, erasing most of the previous day's losses.
May 14 (Wed)
During the London trading hours, some media outlets reported that the U.S. and South Korea were discussing foreign exchange policy. This news strengthened the trend of selling dollars. The USDJPY fell to 145.60 yen before rallying back.
In response to this news, the EURUSD rose to the 1.126 range but then was pushed back to the 1.116 range. Similarly, the GBPUSD rose to the 1.336 range but then declined to the 1.325 range to close the daily trading session.
May 15 (Thu)
The USDJPY continued to decline, reaching the lower 146 yen range. Amid lingering concerns that the U.S. is pressuring Asian countries to strengthen their currencies, traders took a risk-off stance and bought the yen.
Meanwhile, the EURUSD hovered around 1.12, while the GBPUSD rose slightly to the 1.33 range.
May 16 (Fri)
The USDJPY fell to the 144.9 yen range during the Tokyo trading hours, nearly erasing the gains made earlier in the week following the U.S.-China trade agreement. Then, the pair rebounded to the 146.1 yen range as traders bought back the dollar. However, it fell back to the 145.5 yen range just before the close of the weekly trading session.
The EURUSD fell to the 1.113 range during trading hours, while the GBPUSD fell to the 1.325 range to conclude the weekly trading session.
Economic Indicators and Statements to Watch this Week
(All times are in GMT)
May 19 (Mon)
- 09:00 Europe: April Harmonised Index of Consumer Prices (revised HICP)
- 09:00 Europe: April Harmonised Index of Consumer Prices (revised HICP core index)
May 22 (Thu)
- 11:30 Europe: European Central Bank (ECB) Governing Council meeting minutes
- 23:30 Japan: April Consumer Price Index (CPI, all items, year-on-year data)
- 23:30 Japan: April Consumer Price Index (CPI, all items less fresh food)
- 23:30 Japan: April Consumer Price Index (CPI, all items less fresh food and energy)
May 23 (Fri)
- 14:00 U.S.: April new home sales
This Week's Forecast
The following currency pair charts are analyzed using an overlay of the ±1σ and ±2σ standard deviation Bollinger Bands, with a 20-period moving average.
USDJPY
The USDJPY erased the gains made on May 12th to close last week's trading session. At the G7 Finance Ministers and Central Bank Governors' Meeting in Canada, the U.S. and Japan are expected to hold a bilateral discussion. If the weak yen is up for discussion, the yen-buying trend will likely accelerate.
Next is an analysis of the USDJPY daily chart.
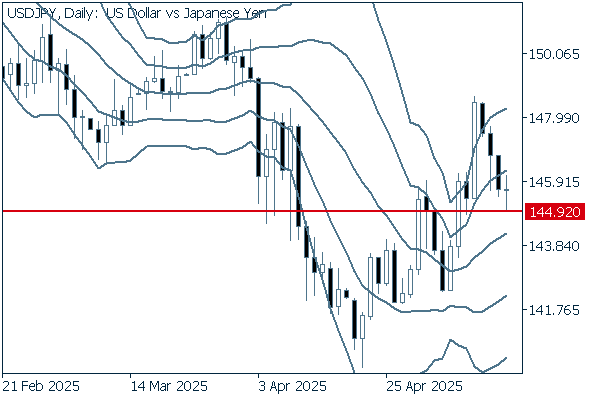
After reaching the 148 yen range at the beginning of last week, the pair continued to decline. Additionally, a doji candlestick pattern has appeared. In the short term, it is difficult to predict this pair's direction. However, if it clearly falls below the 144.92 yen level, the pair may reach the middle line.
We continue with an analysis of the USDJPY weekly chart.
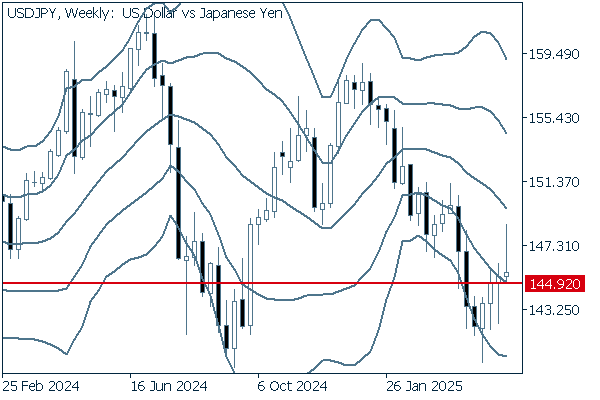
On the weekly chart, four consecutive positive candlesticks have appeared. However, the latest candlestick has a long upper wick. The pair failed to close above the previous week's high, indicating that the selling pressure is mounting. If the pair closes below last week's low of 144.92 yen, the downtrend could accelerate, and the pair could fall toward 140 yen.
EURUSD
After recovering from the May 12th decline, the EURUSD has been fluctuating within a narrow range. If the U.S. and China reach a compromise in their trade negotiations or at the leaders' summit, the dollar is likely to rise. Headlines related to U.S. tariffs will continue to dominate the market.
Next is an analysis of the EURUSD daily chart.
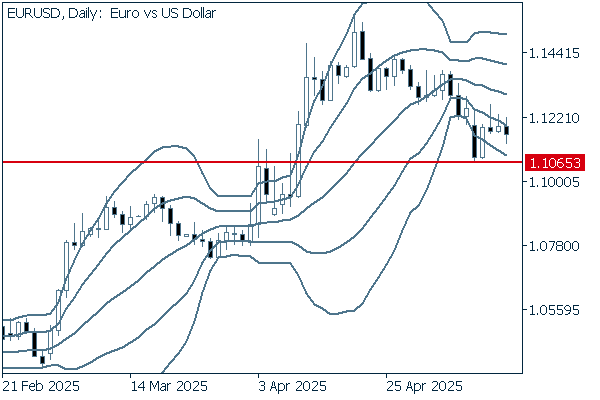
The euro's uptrend has come to an end. The pair is now fluctuating below the middle line to test the low in the face of mounting selling pressure. If the pair falls below last week's low of 1.1065, it will likely reach 1.10. If it falls further, it may be fair to say that the pair has entered a downtrend.
We continue with an analysis of the EURUSD weekly chart.
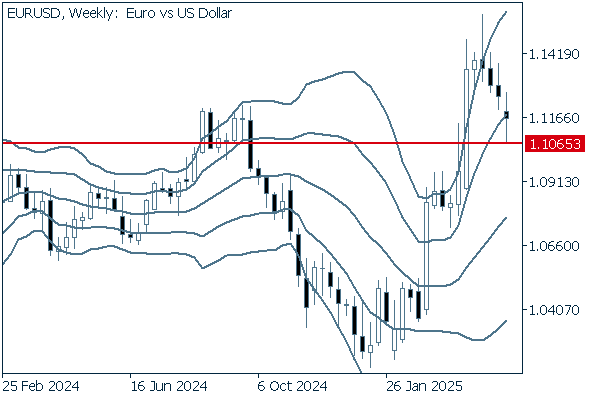
The middle line maintains an upward trend. However, four consecutive negative candlesticks with long upper wicks indicate mounting selling pressure. The pair did show a rebound after falling below +1σ last week. Nevertheless, if the candlestick body falls below 1.1065, the pair may decline to around 1.07.
GBPUSD
At the start of last week, the GBPUSD fell to the 1.314 range and then rebounded to erase the loss. Since then, the pair has been trading in a narrow range, as is the case with the EURUSD. The dollar's behavior will likely continue to dominate the market.
Now, we analyze the daily GBPUSD chart.
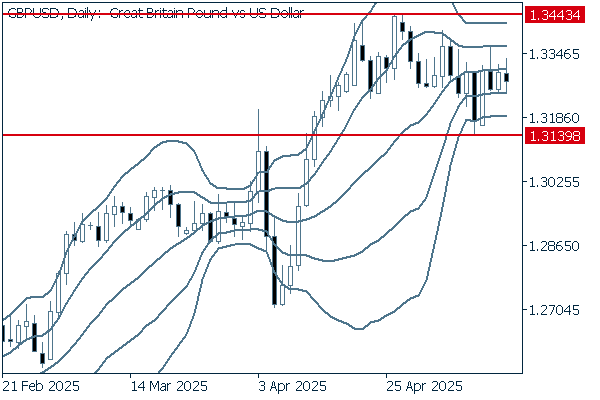
On the daily chart, the band width is shrinking, and the middle line goes flat. The pair has been hovering around the middle line. It is important to see whether the pair will break above the recent high of 1.3343 and continue upward or break below the recent low of 1.3139 and continue downward.
We continue with an analysis of the GBPUSD weekly chart.
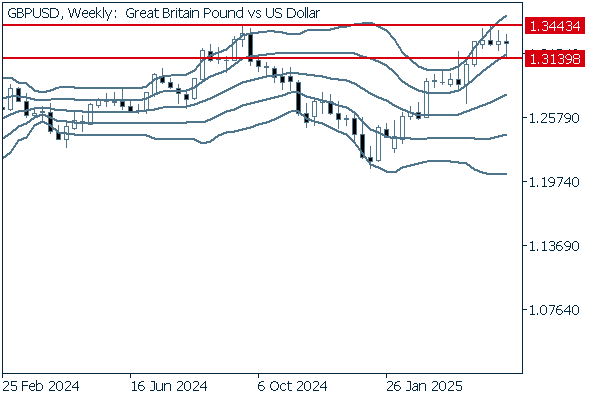
On the weekly chart, the middle line maintains an upward trend. Therefore, it is important to see if the pair will break above the 1.3443 level. However, given the mounting selling pressure, if the pair falls below 1.3139, it may drop as low as 1.30.
Don't miss trade opportunities with a 99.9% execution rate
Was this article helpful?
0 out of 0 people found this article helpful.
Thank you for your feedback.
Send