


2025.03.03
This article was :
published
updated
Weekly FX Market Review and Key Points for the Week Ahead
The foreign exchange market waffled during the week that ended on March 2nd. While sluggish U.S. economic data initially pushed the dollar lower, political factors lifted the dollar later in the week. After falling to the 148 yen range, the USDJPY recovered to the upper 150 yen range by the end of the week.
Meanwhile, political uncertainties in the Eurozone and the trade conflict with the U.S. triggered the sell-off in the euro. The pound also weakened towards the end of the week.
February 24 (Mon)
The USDJPY started the weekly trading session by rising to the upper 149 yen range. However, the pair slipped just before the psychological 150 yen level to the 149.1 yen range.
Meanwhile, traders' heightened anticipation of a new German administration encouraged them to buy the euro. The EURUSD broke above the 1.05 level before falling back to the upper 1.04 range. The GBPUSD fell back to the lower 1.26 range after touching just below 1.27.
February 25 (Tue)
During the Tokyo session, the USDJPY climbed to the 150.3 yen range as the momentum of yen selling increased. However, the pair plunged to the 148.60 yen range after the U.S. Consumer Confidence Index showed a decline. Meanwhile, the steady EURUSD crossed above the 1.05 level. The GBPUSD also remained firm, reaching the upper 1.26 range.
February 26 (Wed)
The USDJPY rose to the upper 149 yen range. However, heightened risk-off sentiment pushed the pair below the 149 yen level during the New York session. After President Donald Trump announced that the U.S. would impose a 25% tariff on cars and other goods from Europe, traders moved to sell the euro.
After recovering to the 1.05 level, the EURUSD fell back to the 1.04 range. The GBPUSD remained in the upper 1.26 range and briefly broke above the 1.27 level.
February 27 (Thu)
Traders remained in a risk-off stance as President Trump announced that the U.S. would impose an additional 10% tariff on imports from Mexico, Canada and China, effective March 4th. The USDJPY fluctuated steadily. However, the momentum of dollar buying was too weak to reach the 150 yen range.
Meanwhile, as the dollar strengthened against the euro and pound, the EURUSD fell to 1.039 and the GBPUSD slipped below 1.26.
February 28 (Fri)
The USDJPY rose to the 150.9 yen range during the New York session but failed to reach 151 yen.
The meeting between President Trump and Ukrainian President Volodymyr Zelensky turned into a heated exchange that ended in a stalemate. However, although some risk-off traders sold the dollar and bought the yen, the market as a whole showed a limited reaction to the breakoff.
Following the meeting, the EURUSD fell to the 1.03 range. The GBPUSD was also driven down to the 1.255 range.
Economic Indicators and Statements to Watch this Week
(All times are in GMT)
March 3 (Mon)
- 10:00 Europe: February Harmonised Index of Consumer Prices (preliminary HICP)
- 10:00 Europe: February Harmonised Index of Consumer Prices (preliminary HICP core index)
- 15:00 U.S.: February ISM Manufacturing PMI
March 5 (Wed)
- 13:15 U.S.: February ADP National Employment Report
- 15:00 U.S.: February ISM Non-Manufacturing PMI (composite)
March 6 (Thu)
- 13:15 Europe: European Central Bank (ECB) Governing Council policy interest rate announcement
- 13:45 Europe: Regular press conference by ECB President Christine Lagarde
March 7 (Fri)
- 10:00 Europe: October-December quarterly regional gross domestic product (revised regional GDP)
- 13:30 U.S.: February change in nonfarm payrolls
- 13:30 U.S.: February unemployment rate
- 13:30 U.S.: February average hourly earnings
- 13:30 U.S.: February average hourly earnings (year-on-year data)
This Week's Forecast
The following currency pair charts are analyzed using an overlay of the ±1σ and ±2σ standard deviation Bollinger Bands, with a 20-period moving average.
USDJPY
The U.S. will start to impose tariffs on imports from Mexico, Canada and China on March 4th. On the same day, President Trump will address a joint session of Congress. As the Trump-Zelensky summit ended in a stalemate, traders have become increasingly risk averse. This week, the market is likely to be affected by a number of news reports.
Next is an analysis of the USDJPY daily chart.
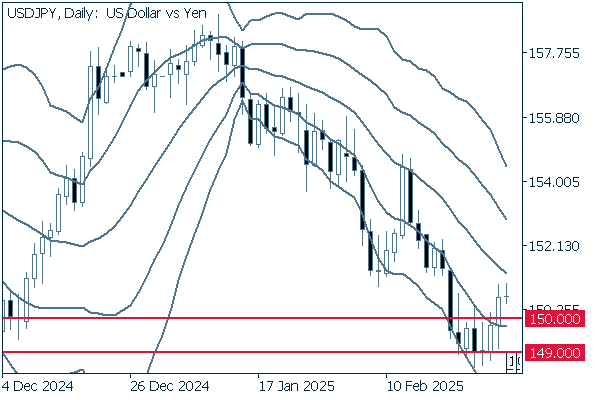
After falling below 149 yen, the pair has been on a rebounding path and climbed above the 150 yen level. However, unless the real body of the daily chart's candlestick shows that the pair crosses above the middle line, it is safe to say that the downtrend will continue.
We continue with an analysis of the USDJPY weekly chart.
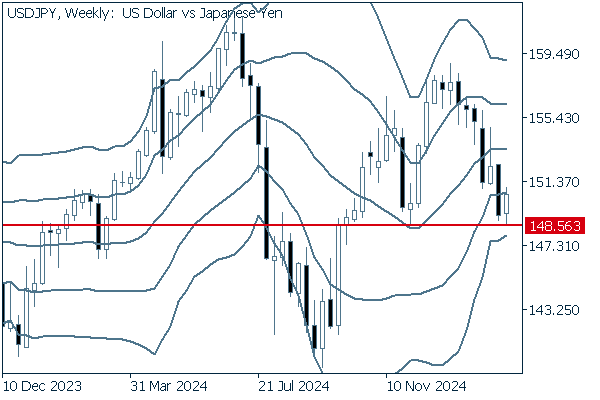
The flattened middle line on the weekly chart makes it difficult to forecast the direction. If the pair breaks below its recent low of 148.56 yen, it is likely that the pair will continue to fall.
EURUSD
The ECB Governing Council is expected to cut interest rates by 0.25% on March 6th. In addition, the Trump administration's tariff policy and tensions over the situation in Ukraine will make traders more risk-off. The selling momentum in the euro is likely to increase.
Next is an analysis of the EURUSD daily chart.
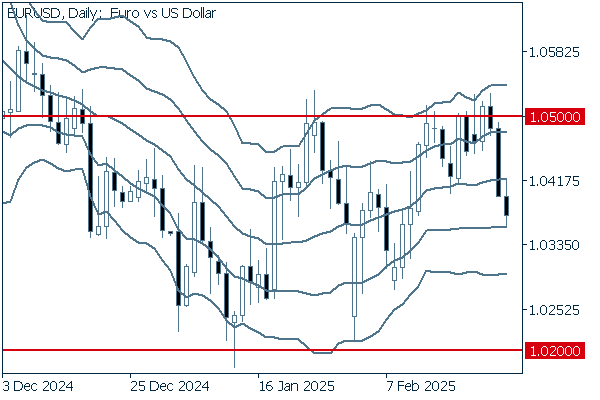
The pair crossed below the gently ascending middle line and temporarily reached as low as -1σ. From a long-term perspective, it has been fluctuating within a box-shaped range between 1.02 and 1.05, making it difficult to forecast the direction.
We continue with an analysis of the EURUSD weekly chart.
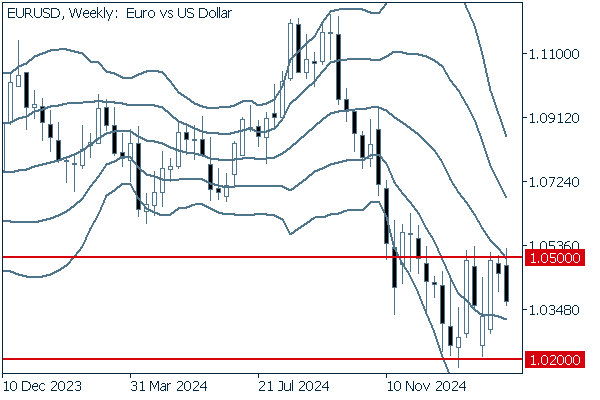
On the weekly chart, the pair touched the middle line last week. However, it failed to break above the line and was pushed back. If the real body of the candlestick shows that the pair breaks above the 1.05 level, then it is time to have a more upward outlook. Also, the support level for the current range seems to lie around the 1.02 level.
GBPUSD
British Prime Minister Keir Starmer met with President Trump with a proposal that the U.K. increase spending on the defense budget. However, there was no mention of tariffs. As risk-off sentiment spreads, the pound tends to weaken against the dollar. In such an unstable situation, the dollar will dominate the GBPUSD.
Now, we analyze the daily GBPUSD chart.
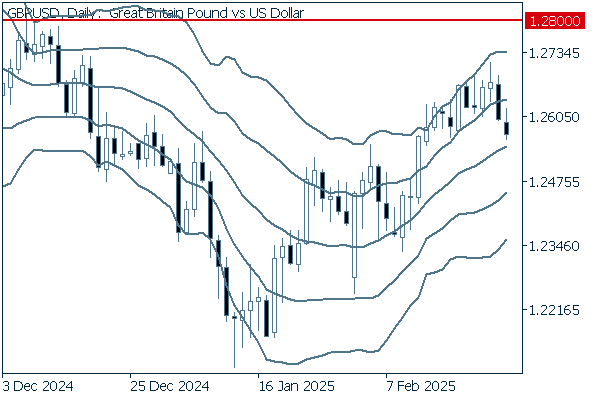
The upward band walk has been halted. However, there is a possibility that the pair will make a rebound and rise further. As the middle line is in an uptrend, it seems likely that the pair will continue to rise.
We continue with an analysis of the GBPUSD weekly chart.
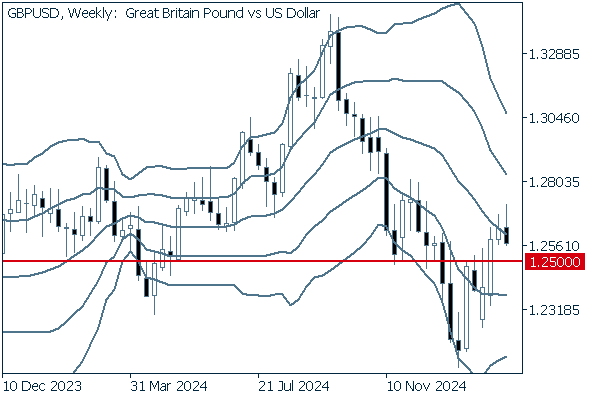
On the weekly chart, the streak of three positive candlesticks was snapped last week. As the selling pressure on the euro has increased slightly, if the pair falls below the 1.25 level, it would be better to have a downward outlook.
Was this article helpful?
0 out of 0 people found this article helpful.
Thank you for your feedback.
Send