2024.12.09
This article was :
published
updated
Weekly FX Market Review and Key Points for the Week Ahead
The foreign exchange market for the week that ended on December 8th got nervous over political events in the U.S. and Asia, as well as economic indicators.
The USDJPY rose to the upper 150 yen range earlier in the week but then fell back to the 149 yen range as the yen was bought on risk-off sentiment and the U.S. employment data.
The EURUSD and GBPUSD both showed an upward trend, reflecting economic indicators and regional developments.
December 2 (Mon)
The USDJPY extended last week's trend and opened in the upper 149 yen range. The ISM Manufacturing PMI for November registered 48.4%, 1.9% higher than the previous month and 0.8% above expectations. However, after U.S. long-term interest rates trimmed their gains, the pair fell to the lower 149 yen range as dollar selling intensified.
The EURUSD and GBPUSD hit their daily lows of 1.0460 and 1.2617, respectively, which turned out to be their weekly lows. They then began to rise.
December 3 (Tue)
As the Nikkei 225 rose in Japan, the USDJPY briefly rebounded to the lower 150 yen range. However, after South Korean President Yoon Suk Yeo declared martial law, traders took a risk-off stance to buy the yen. The pair plunged to the lower 148 yen range.
Meanwhile, the EURUSD and GBPUSD remained quiet, with no clear trends.
December 4 (Wed)
The lifting of martial law in South Korea and reports suggesting that the Bank of Japan might forgo a rate hike at this month's meeting spurred dollar buying and yen selling. The USDJPY briefly climbed to the lower 151-yen range.
However, the ADP National Employment Report for November fell short of market expectations, registering an increase of 146,000 jobs compared with forecasts for 150,000 jobs and 184,000 jobs in October. Also, the ISM Non-Manufacturing Index for November fell sharply by 3.9% from the previous month to 52.1%, missing expectations of 55.5%. As these disappointing figures led to fears of a slowdown in the U.S. economy, the pair was pushed back to around the 150 yen level.
December 5 (Thu)
As Toyoaki Nakamura, a member of the BOJ's Policy Board, insisted that he is not opposed to a rate hike, the possibility of a December rate hike temporarily rose. The yen strengthened, and the USDJPY fell to the upper 149 yen range before rebounding to the 150 yen level.
December 6 (Fri)
U.S. nonfarm payrolls beat expectations in November, adding 227,000 jobs compared with forecasts for 200,000 and 36,000 in October, while the unemployment rate rose 0.1% from the prior month to 4.2%, which met forecasts. Average hourly earnings showed steady growth of 4.0% year-on-year (forecast: 3.9%, previous: 4.0%).
While the labor market remained solid, the lingering anticipation of a U.S. interest rate cut triggered further dollar selling. The USDJPY fell below the 150 yen level and briefly dropped to around 149.40 yen.
Economic Indicators and Statements to Watch this Week
(All times are in GMT)
December 8 (Sun)
23:50 Japan: July-September quarterly gross domestic product (revised GDP)
December 11 (Wed)
13:30 U.S: November Consumer Price Index(CPI)
13:30 U.S: November Consumer Price Index(CPI core index)
December 12 (Thu)
13:15 Europe: European Central Bank (ECB) Governing Council policy interest rate announcement
13:45 Europe: Press conference by European Central Bank (ECB) President Christine Lagarde
23:50 Japan: Bank of Japan October-December Short-Term Economic Survey of Enterprises (Tankan)
December 13 (Fri)
07:00 U.K.: October monthly gross domestic product (GDP, month-on-month data)
This Week's Forecast
The following currency pair charts are analyzed using an overlay of the ±1 and ±2 standard deviation Bollinger Bands, with a period of 20 days.
USDJPY
The USDJPY has been fluctuating around the 150 yen level. However, with the BOJ expected to raise rates in December and the FOMC expected to announce a rate cut in the same month, the yen is gradually strengthening. While there are no statements from Fed officials amid the blackout period, it is still necessary to pay attention to comments from President-elect Donald Trump.
Next is an analysis of the USDJPY daily chart.
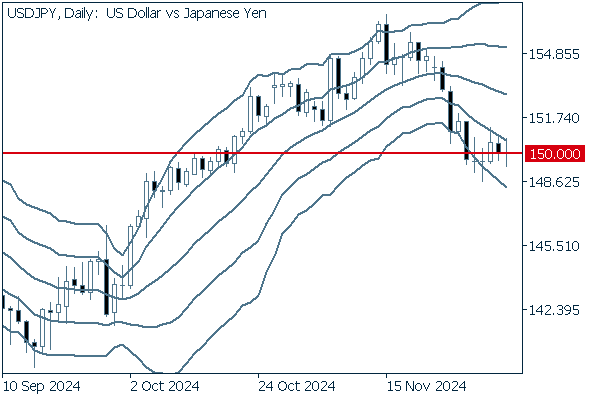
The pair has been fluctuating around the 150 yen level and is finding it difficult to break above -1σ. As the middle line is about to turn into a clear downtrend, it seems better to prepare for the downtrend.
We continue with an analysis of the USDJPY weekly chart.
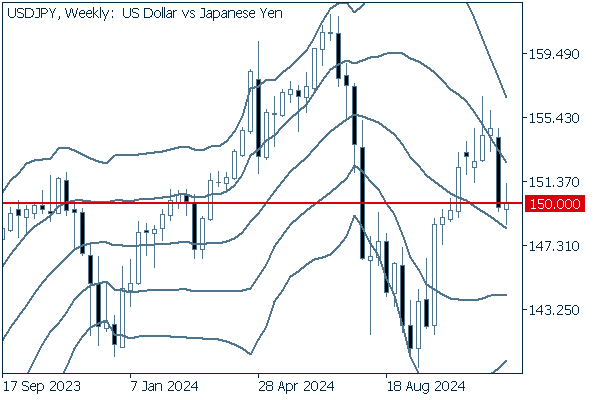
On the weekly chart, a short positive candlestick with long upper and lower wicks has appeared. As the pair failed to close clearly above the 150-yen level in last week's trading, a drop below the middle line could intensify the downtrend.
EURUSD
The EURUSD briefly rose above the 1.06 level following the release of the U.S. employment data on December 6th. However, French political uncertainty weighs on the euro. Additionally, the European Central Bank (ECB) is widely expected to cut interest rates by 0.25% at its December 12th meeting. Therefore, the pair's upward momentum is likely to remain limited.
Next is an analysis of the EURUSD daily chart.
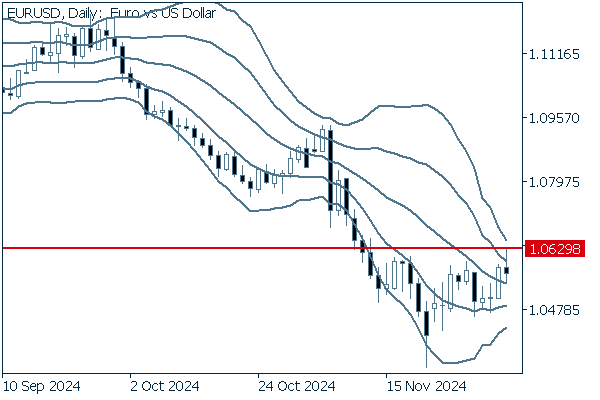
The EURUSD has been gradually rising. After crossing above the middle line, the pair briefly broke above +1σ last week. If the pair breaks above 1.0629, the high of December 6th, the trend could change significantly.
We continue with an analysis of the EURUSD weekly chart.
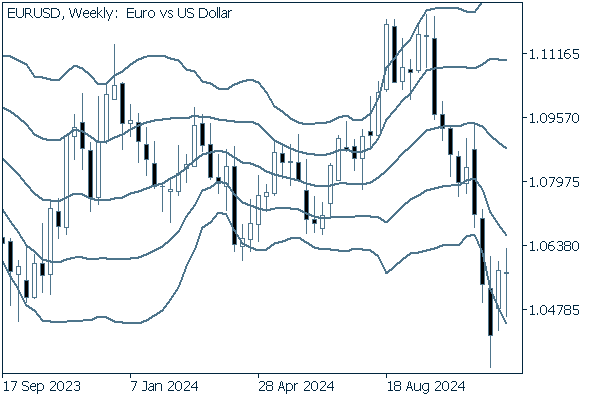
After breaking below -2σ, the pair has begun to rise. At the moment, it is important to see if the pair can break above -1σ.
GBPUSD
The GBPUSD rebounded from its November low and briefly rose above 1.28 on December 6. It will be important to watch the dollar's behavior, especially if it continues to weaken, following the upcoming FOMC meeting.
Now, we analyze the daily GBPUSD chart.
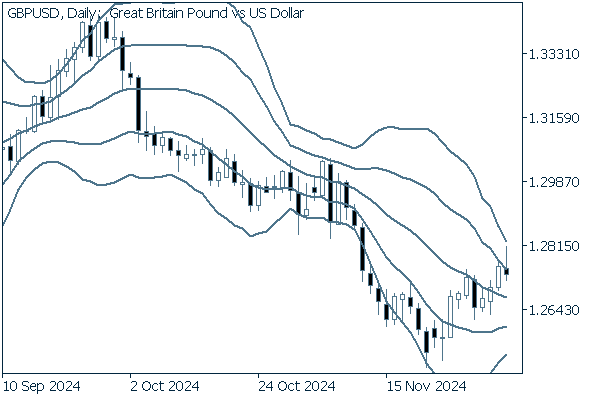
After briefly breaking above +1σ, the pair fell back to close Friday's session. As a result, a negative candlestick with a longer upper wick has appeared. Meanwhile, the middle line is still on a downward trend. Therefore, it is possible that the pair will start to fall from here.
We continue with an analysis of the GBPUSD weekly chart.
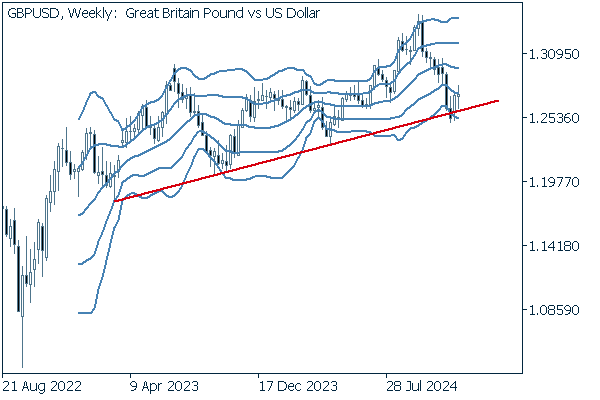
In the longer term, the pair has not broken below the past lows, and a gradually ascending resistance line can be drawn. As with the past rebound phases, the pair rebounded at this resistance line. However, if the pair breaks below the line, a year-long trend reversal cannot be ruled out.
Was this article helpful?
0 out of 0 people found this article helpful.
Thank you for your feedback.
Send