


#technical
#mainchart

#technical
#mainchart
Downloaded:
0
times
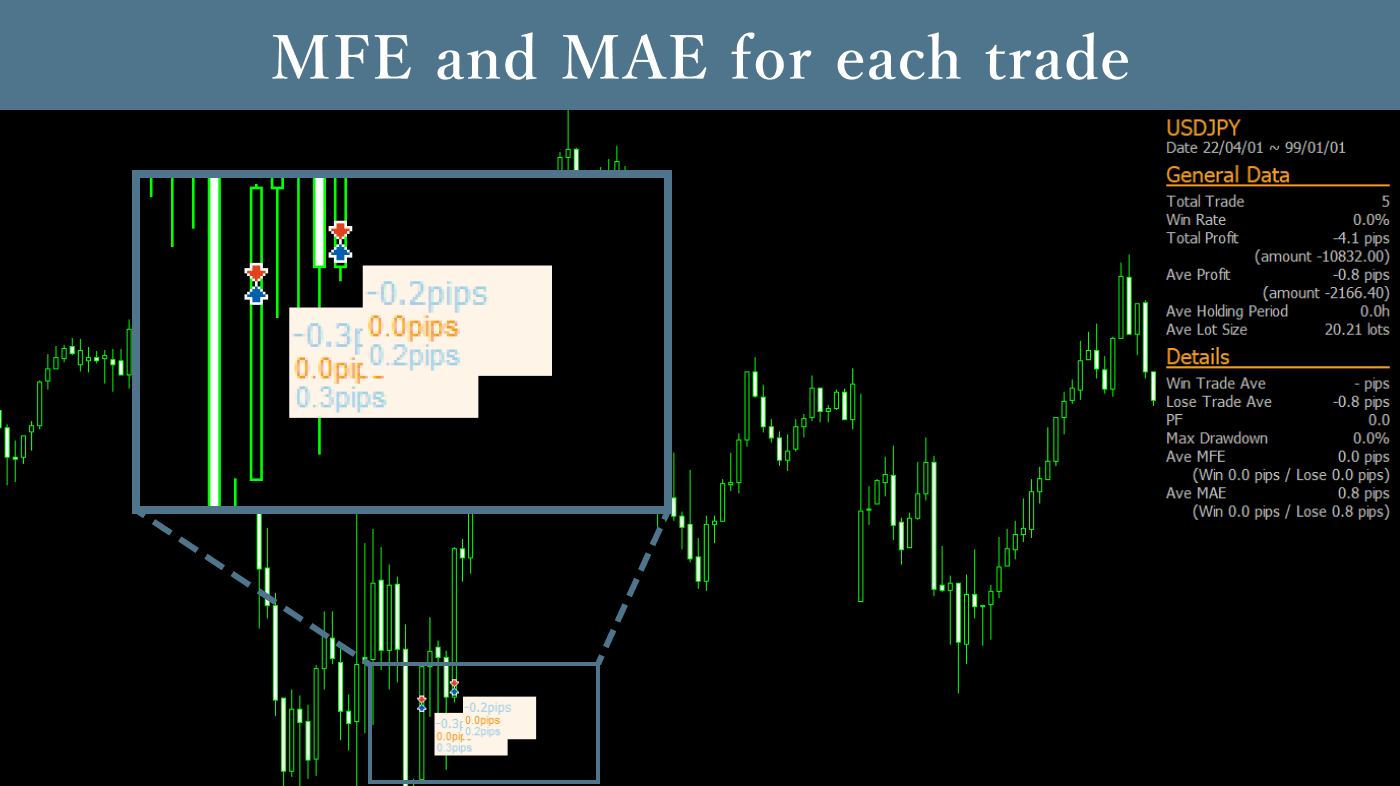
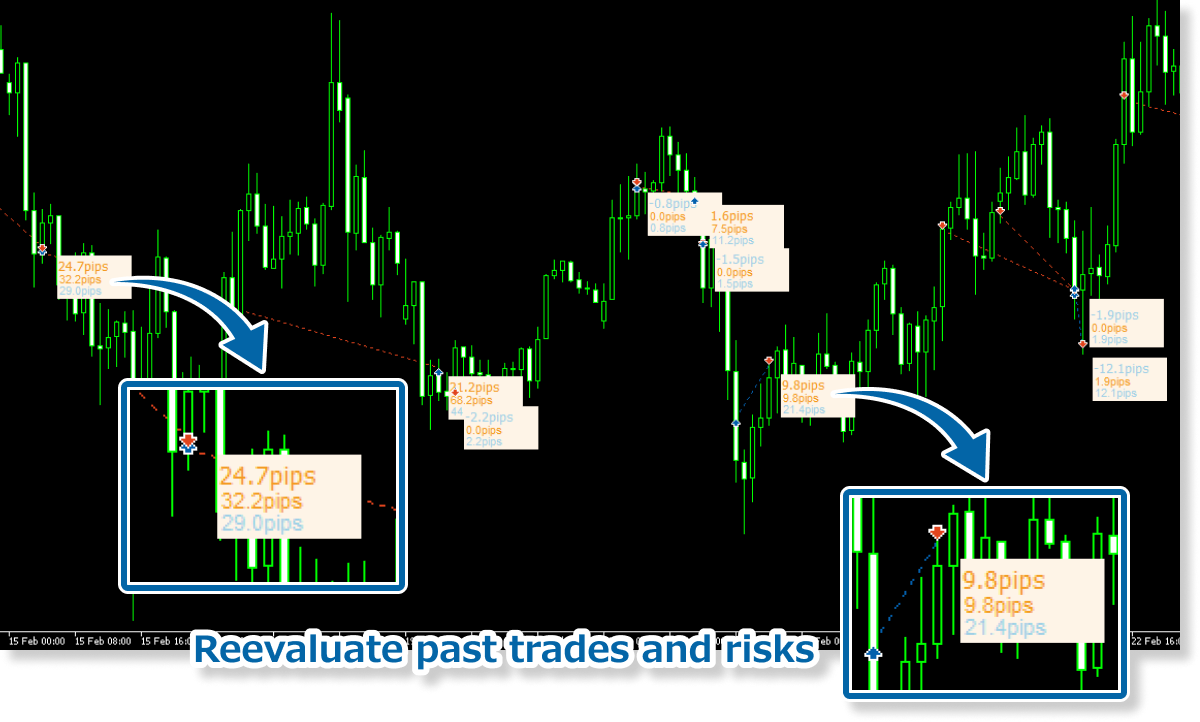
The MFE & MAE Indicator calculates how much unrealized loss or profit occurred in past trades and displays this data on the chart. You can verify whether appropriate trading was conducted by examining the actual timing of position closures.
Downloaded:
0
times
Usage scenarios
For analyzing past trades
You can analyze how effective past trades were by checking information such as average profits and losses and profit factor. It’s not uncommon for winning trades to have too large a maximum adverse excursion (= high risk), so analyzing such trades can be useful for the future.
For reviewing EA and indicator settings
The MFE & MAE Indicator allows you to check various information about past trades. For example, it can be used to judge whether there are problems with your EA or indicator strategy, such as extremely large maximum adverse excursions or high win rates but too small average profits.
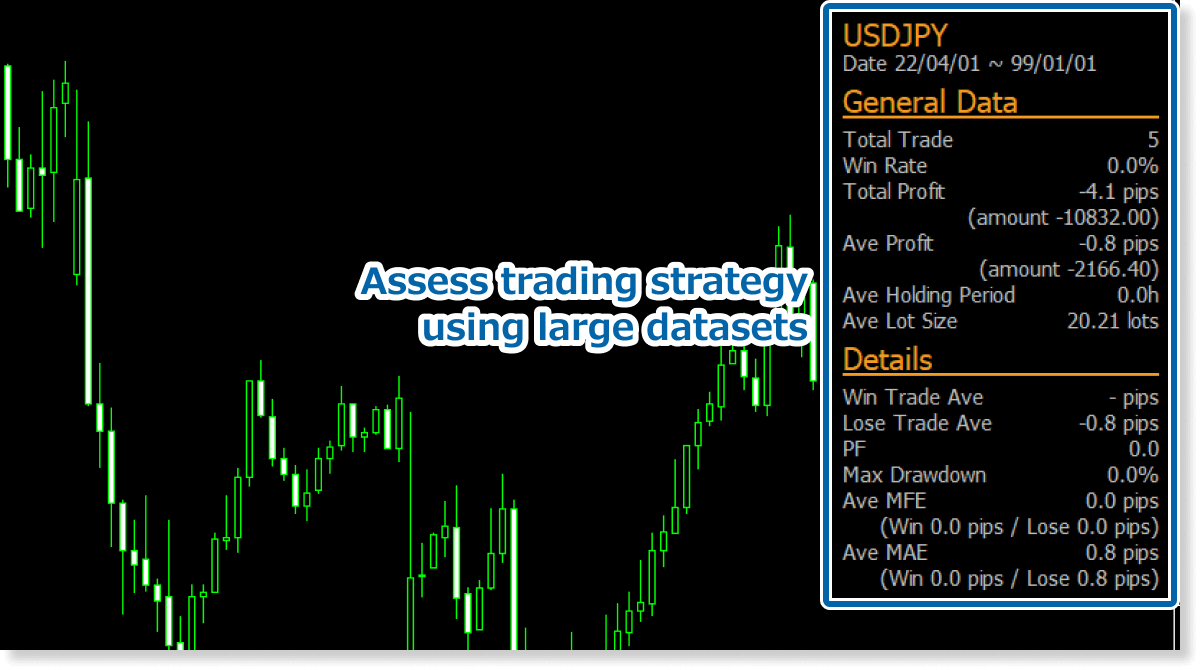
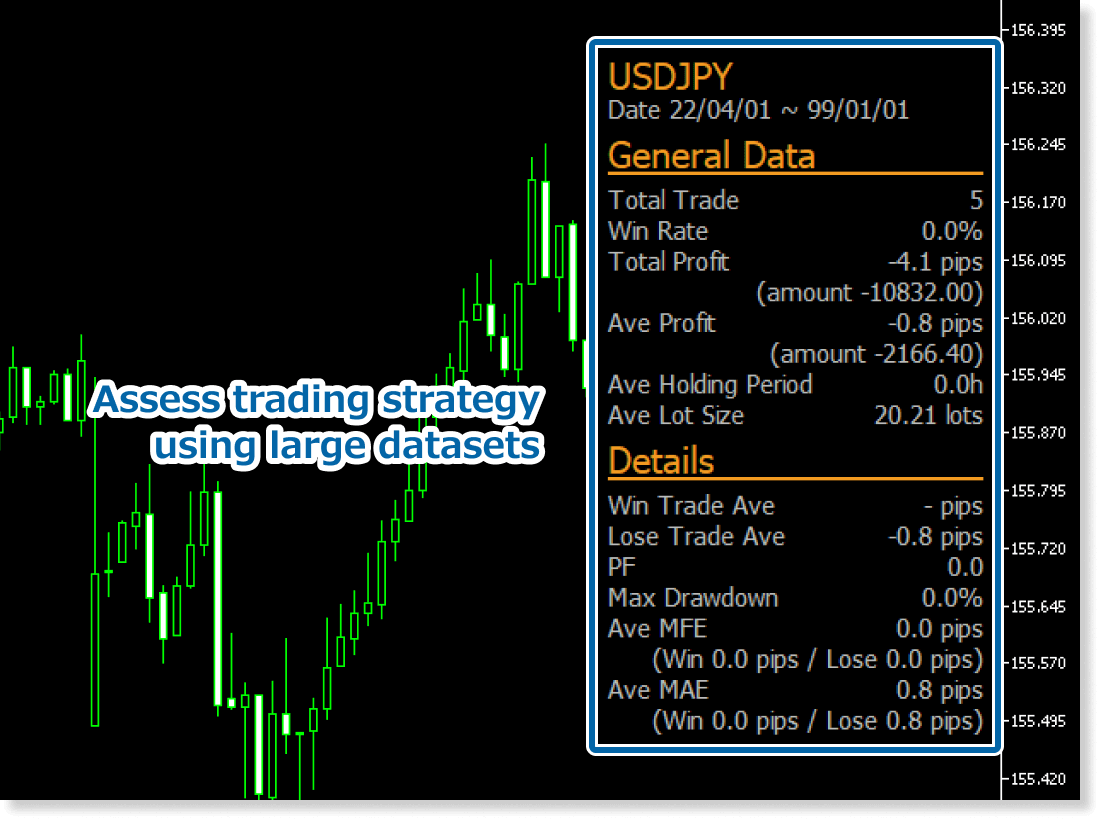
The MFE & MAE Indicator displays a large amount of information needed for analyzing and improving past trades, including not just maximum adverse and favorable excursions but also profit factor and maximum drawdown. Please make use of it for your daily trading and reviews.
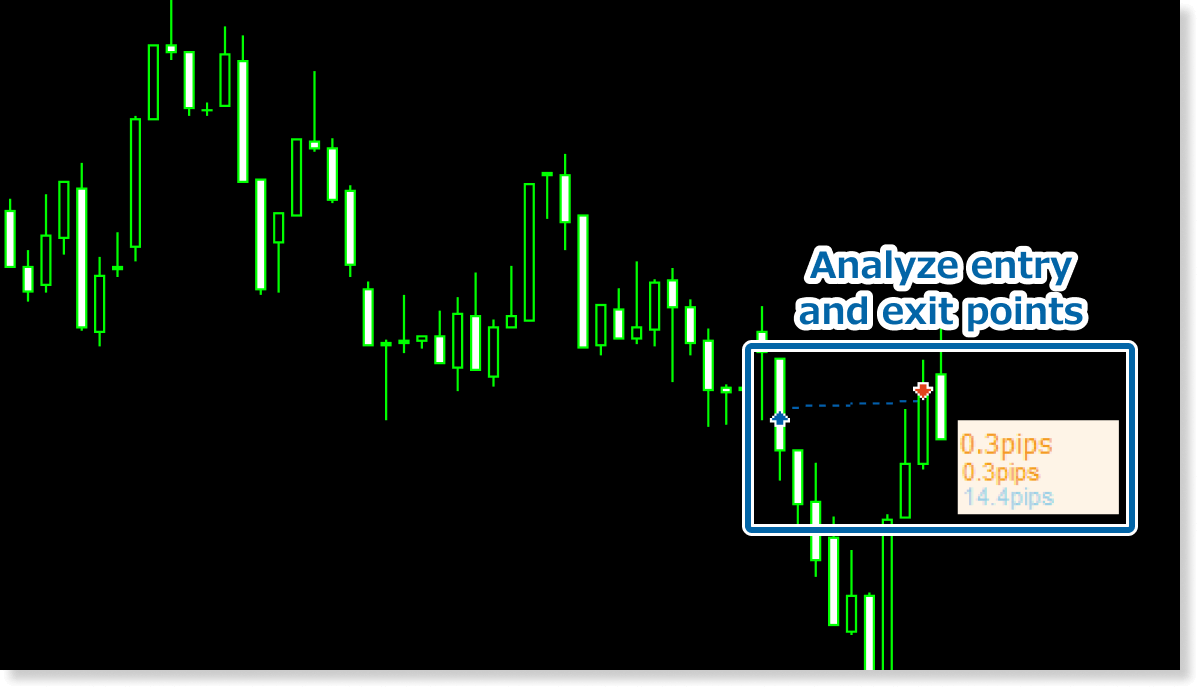
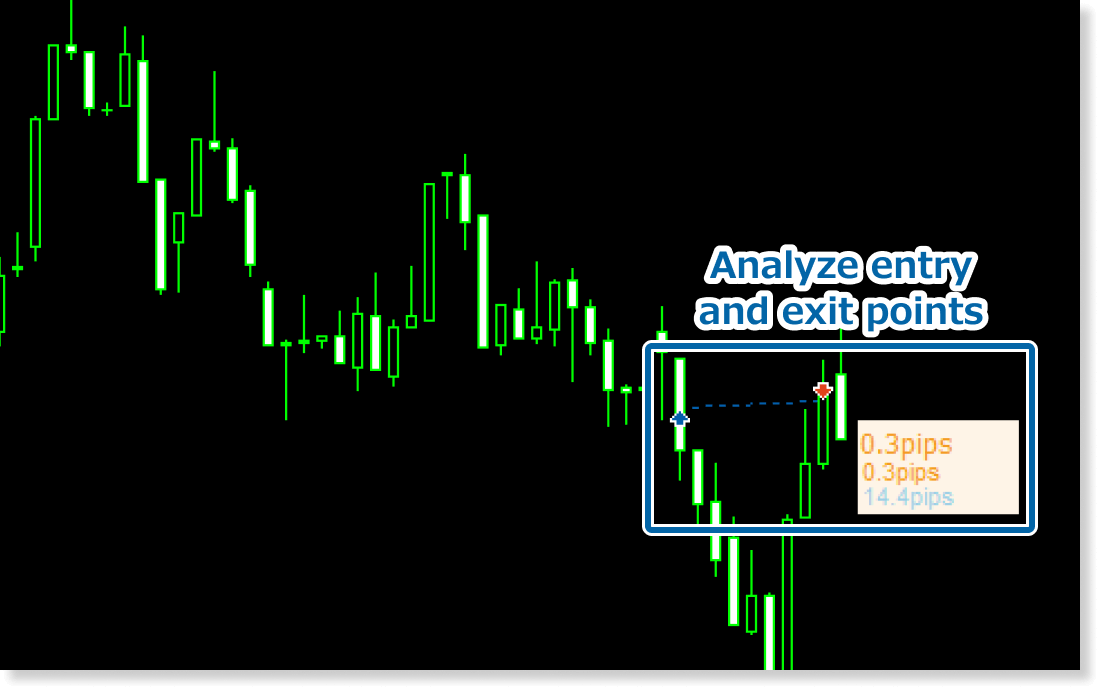
Analyze entry and exit points
This indicator is also useful for assessing past entry and exit points.
For example, if the profit is too small compared to the MFE or if a stop loss was triggered at the MAE, it may indicate that the exit was too late. On the contrary, if the MAE occurred immediately after entry, it could suggest that the entry was too early.
In the MFE & MAE Indicator for MT4, both the period specified in the indicator's parameters and the period set in MT4’s Account History tab influence the displayed data.
For example, if you set the indicator period from January 1 to November 30, 2022, but your Account History is set to display only the last one month, the indicator will only use trades from that limited timeframe. To ensure accurate results, always set the Account History period longer than the full range specified in the indicator.
How to install
To use the MFE & MAE Indicator, follow the steps below to download and install it.
Step 1
Click the button below to download the indicator for MT4/MT5.
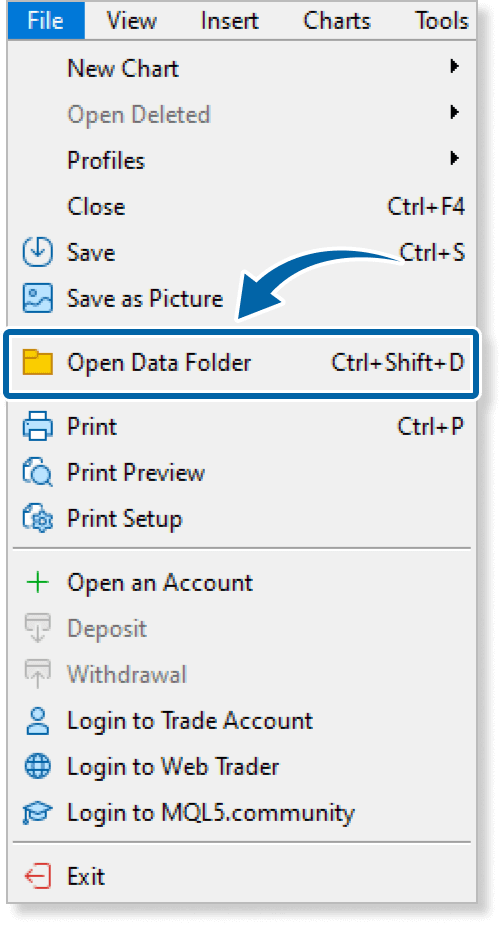
Step 2
Click File > Open Data Folder in the top menu of MT4/MT5.
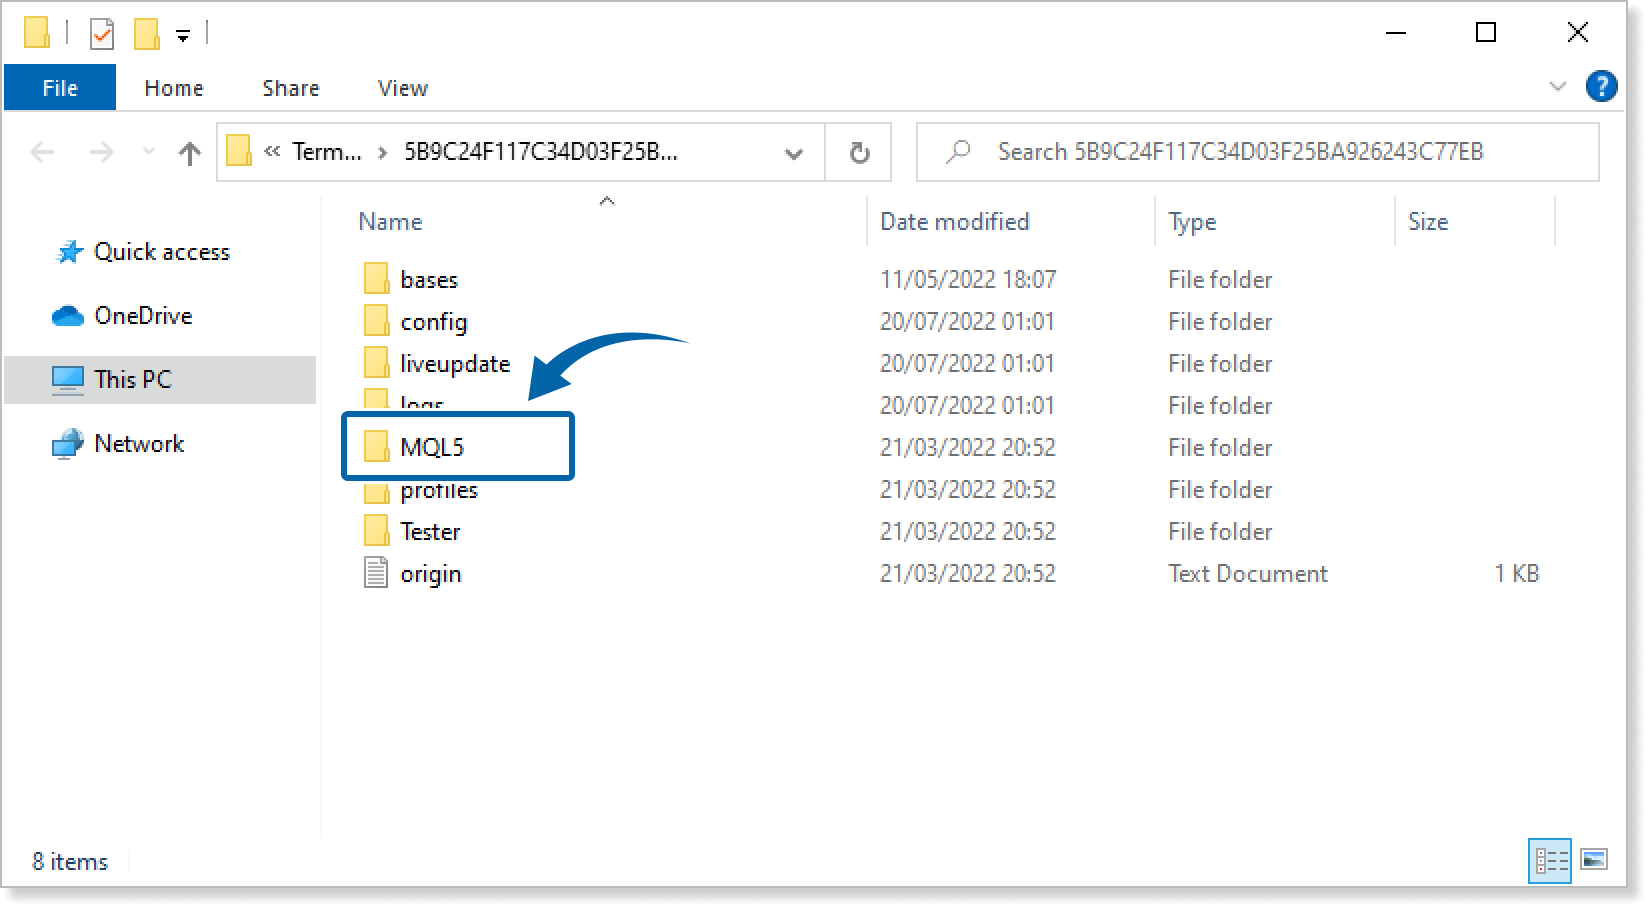
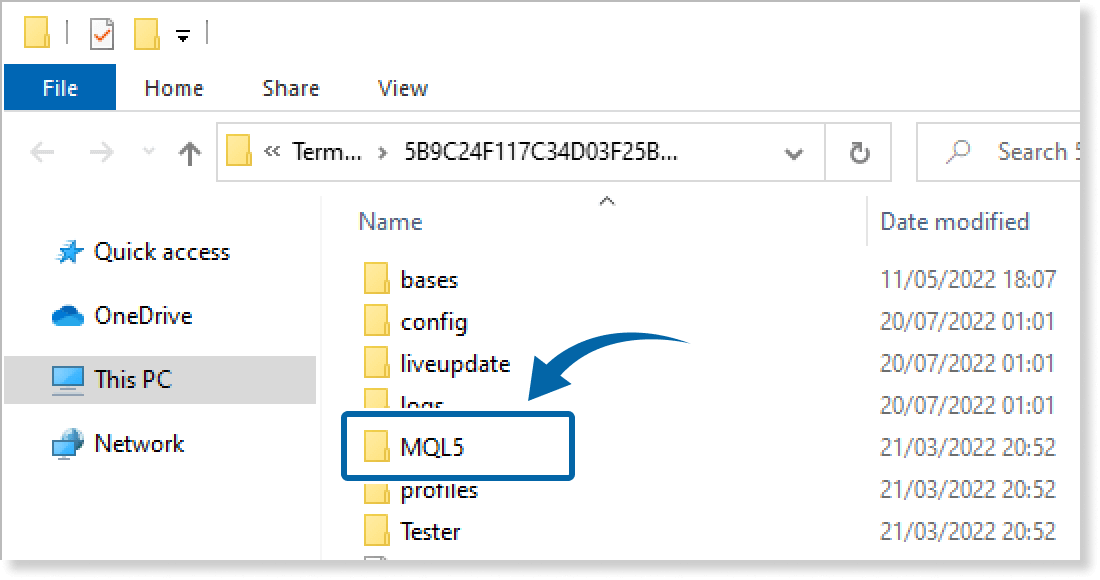
Step 3
In the data folder, double-click the MQL4 or MQL5 folder.
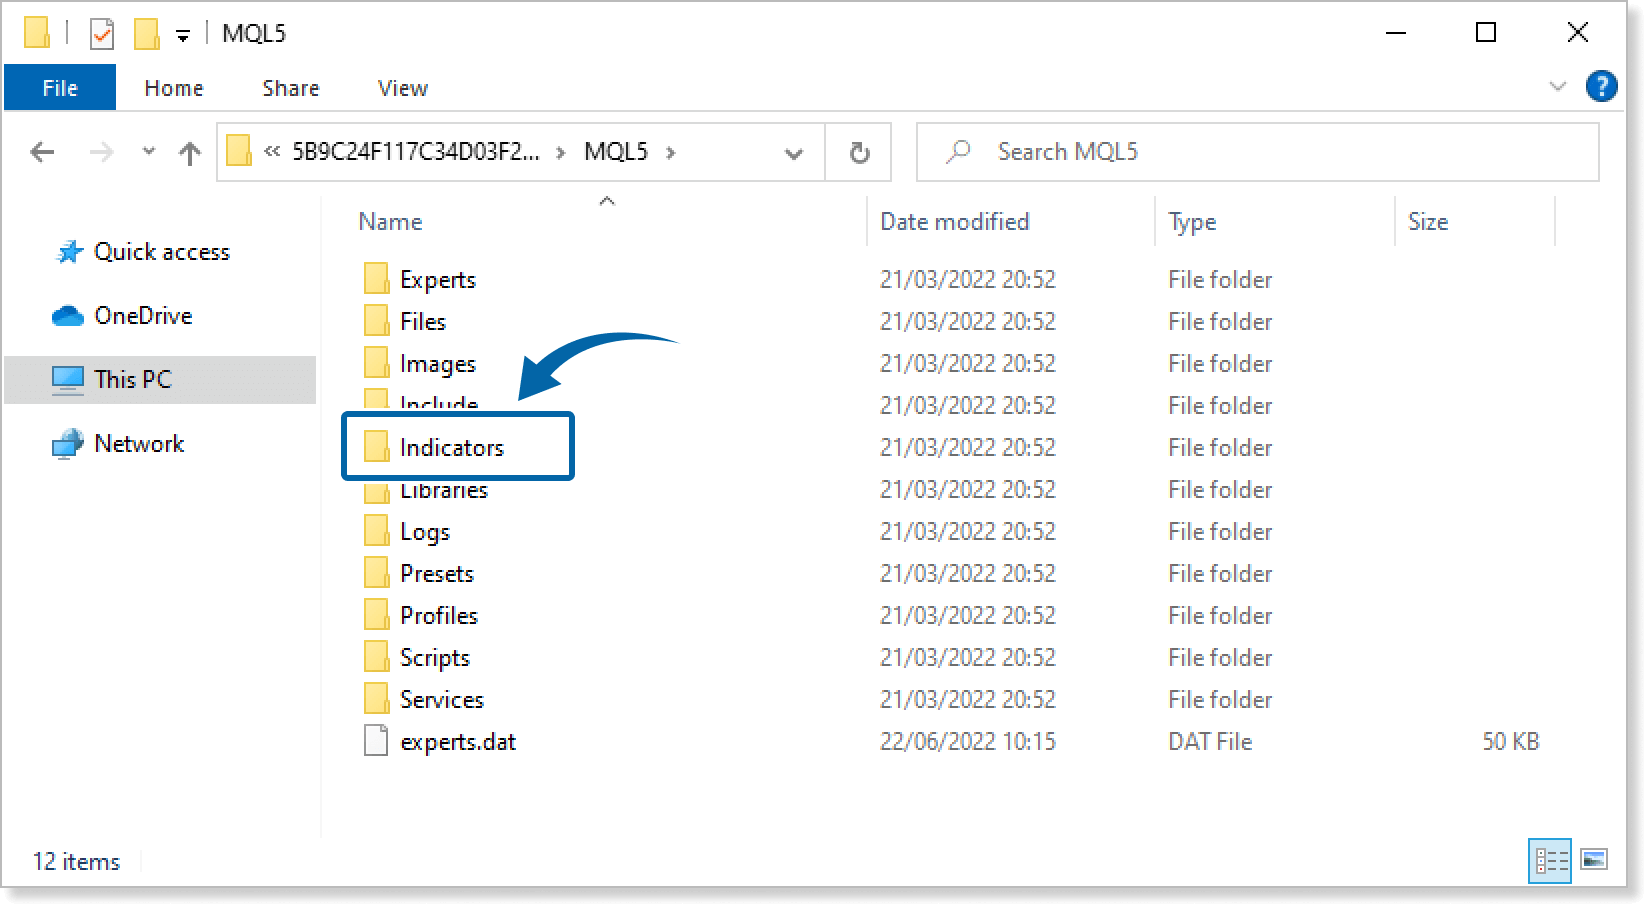
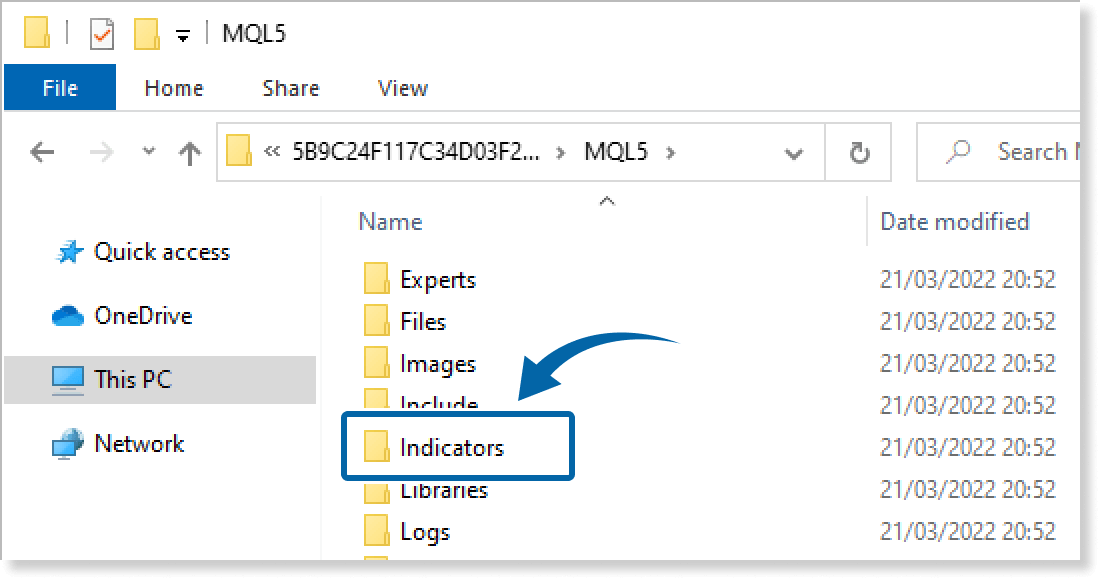
Step 4
In the MQL4/MQL5 folder, double-click the Indicators folder.
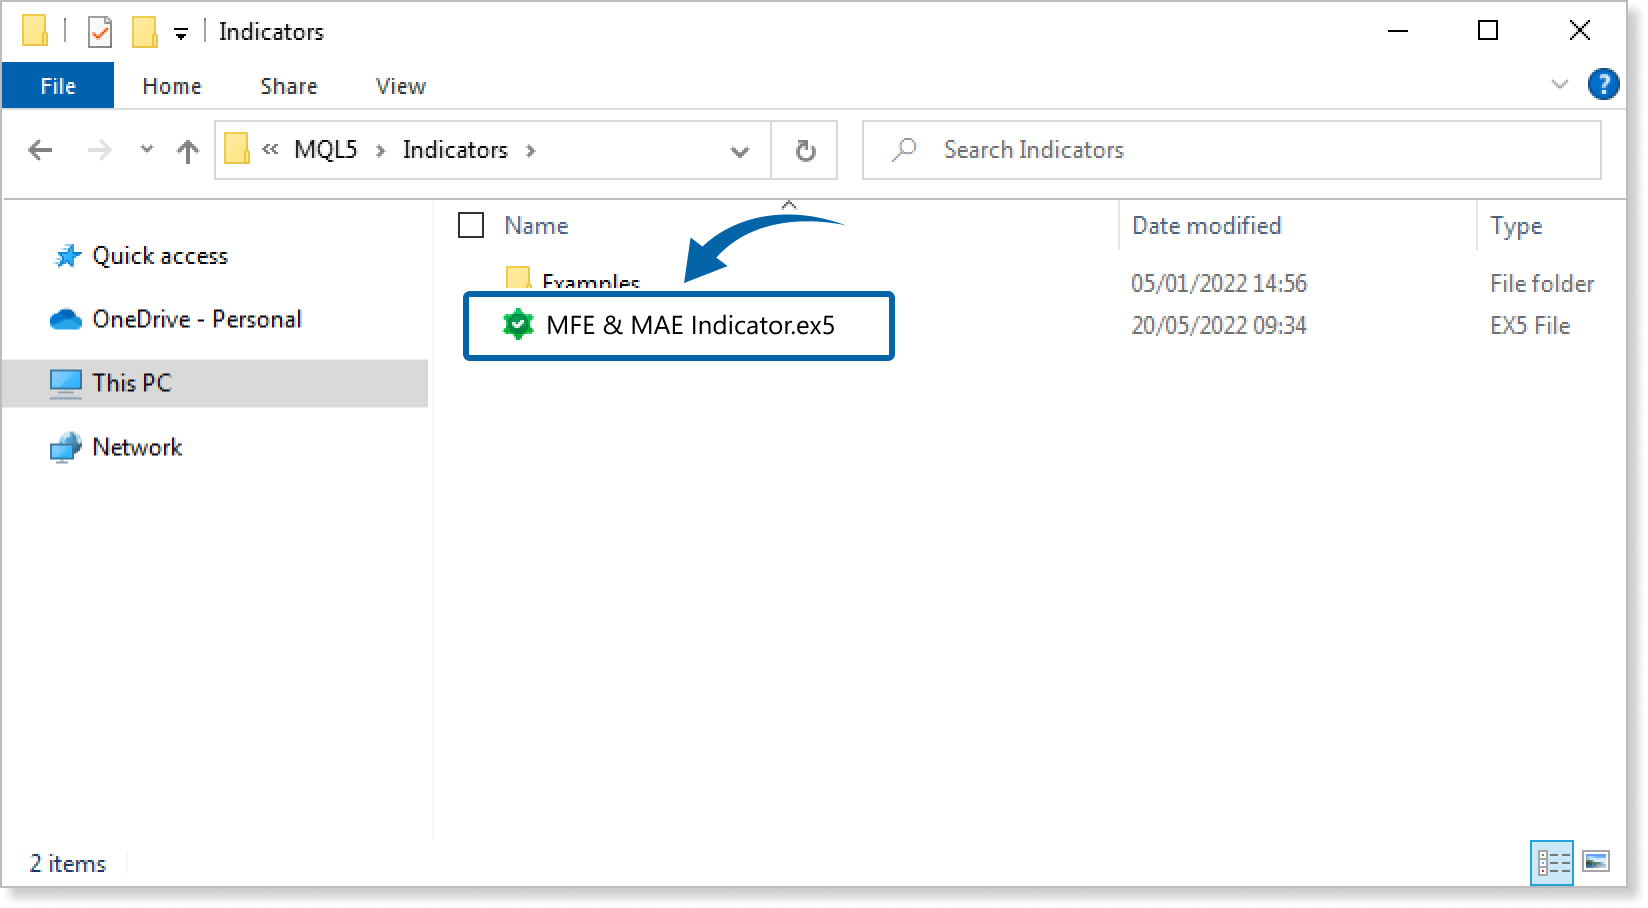
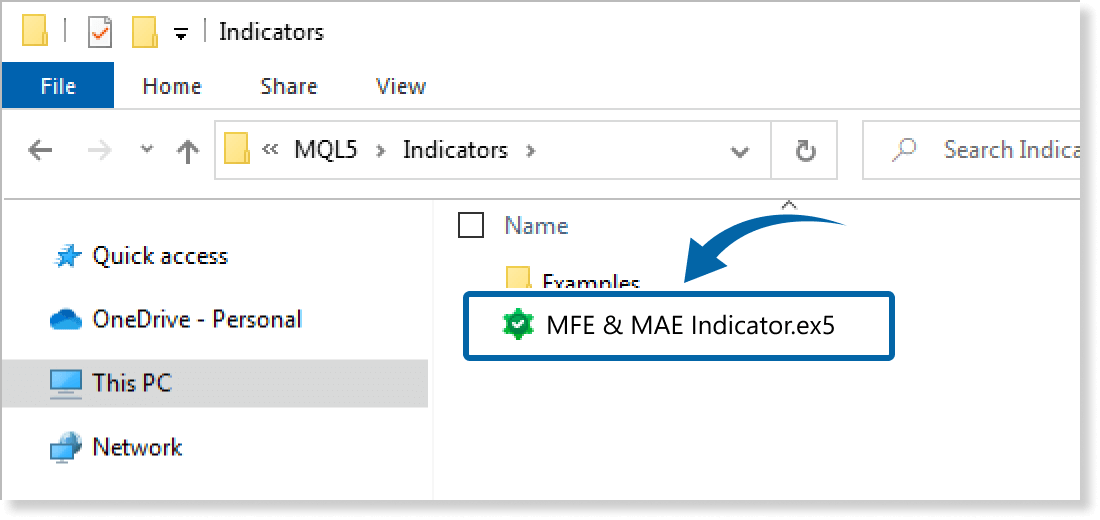
Step 5
Save the MFE & MAE Indicator in the Indicators folder.
Step 6
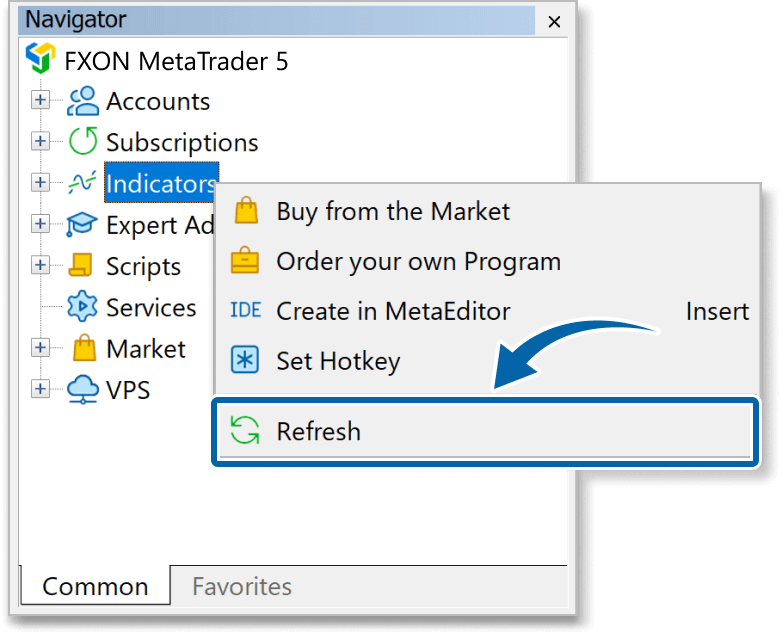
Go back to the MT4/MT5. Right-click Indicators in the Navigator, and click Refresh.
Step 7
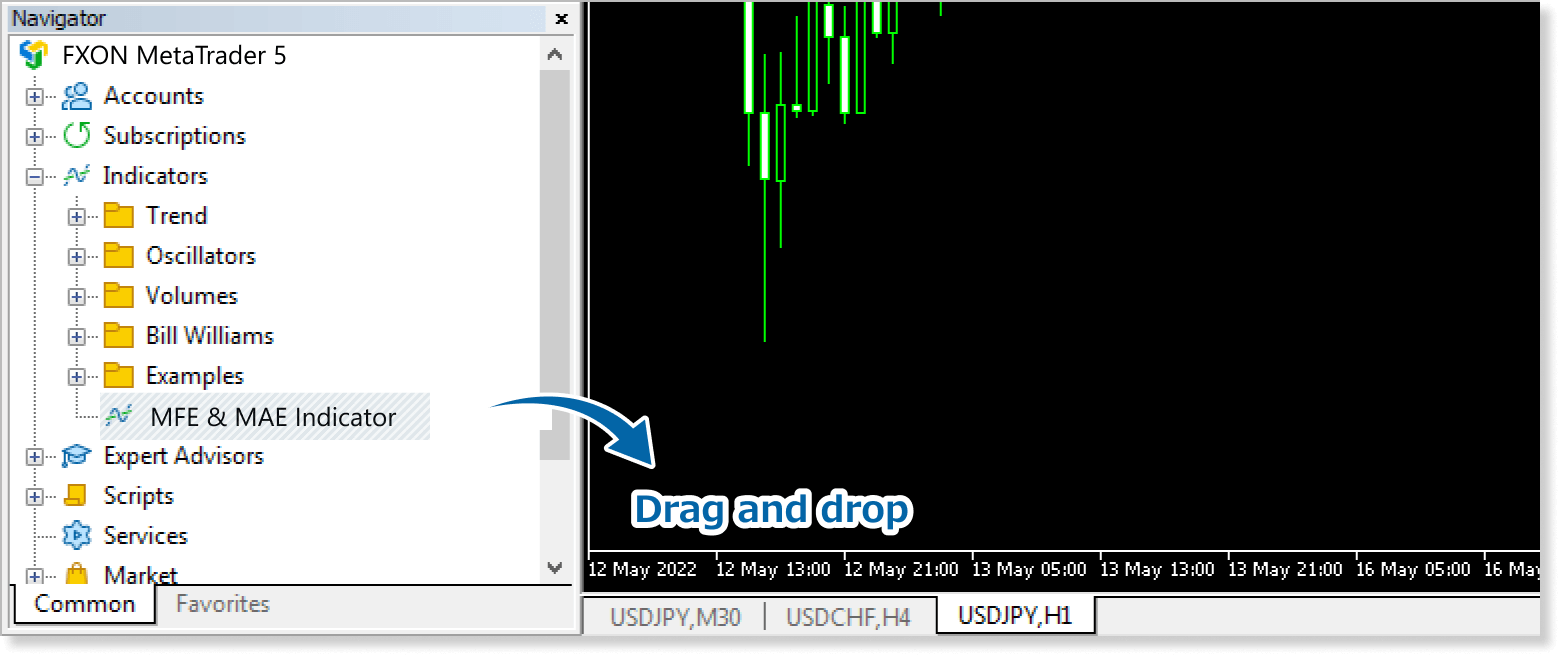
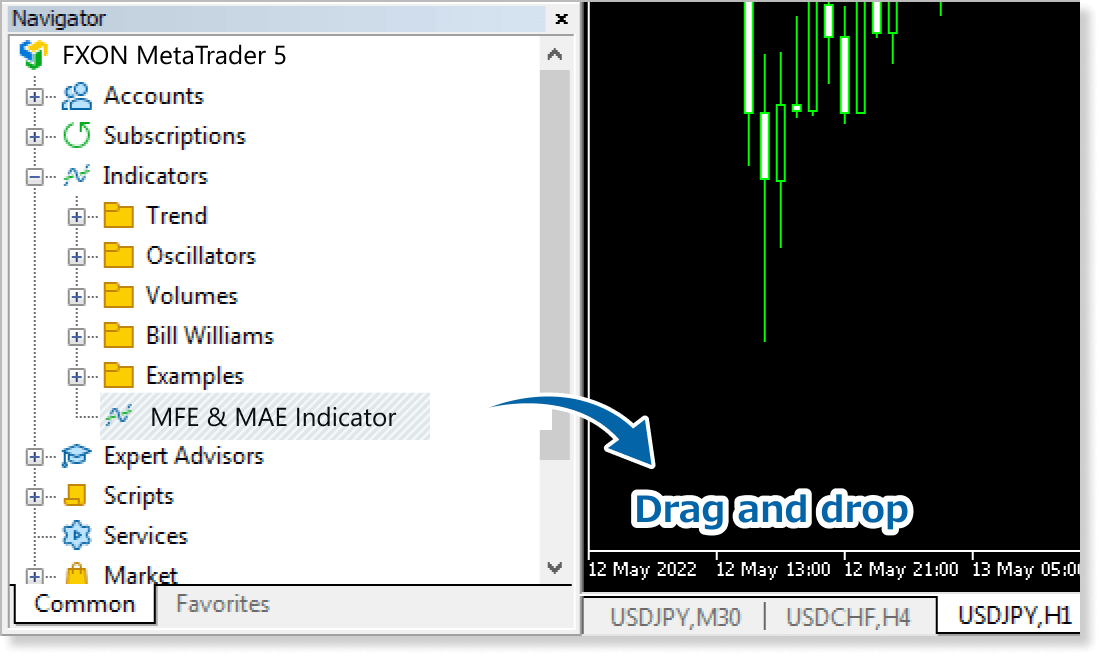
In the Navigator, click the + icon next to Indicators. Find the MFE & MAE Indicator, then either double-click it or drag it onto a chart.
Step 8
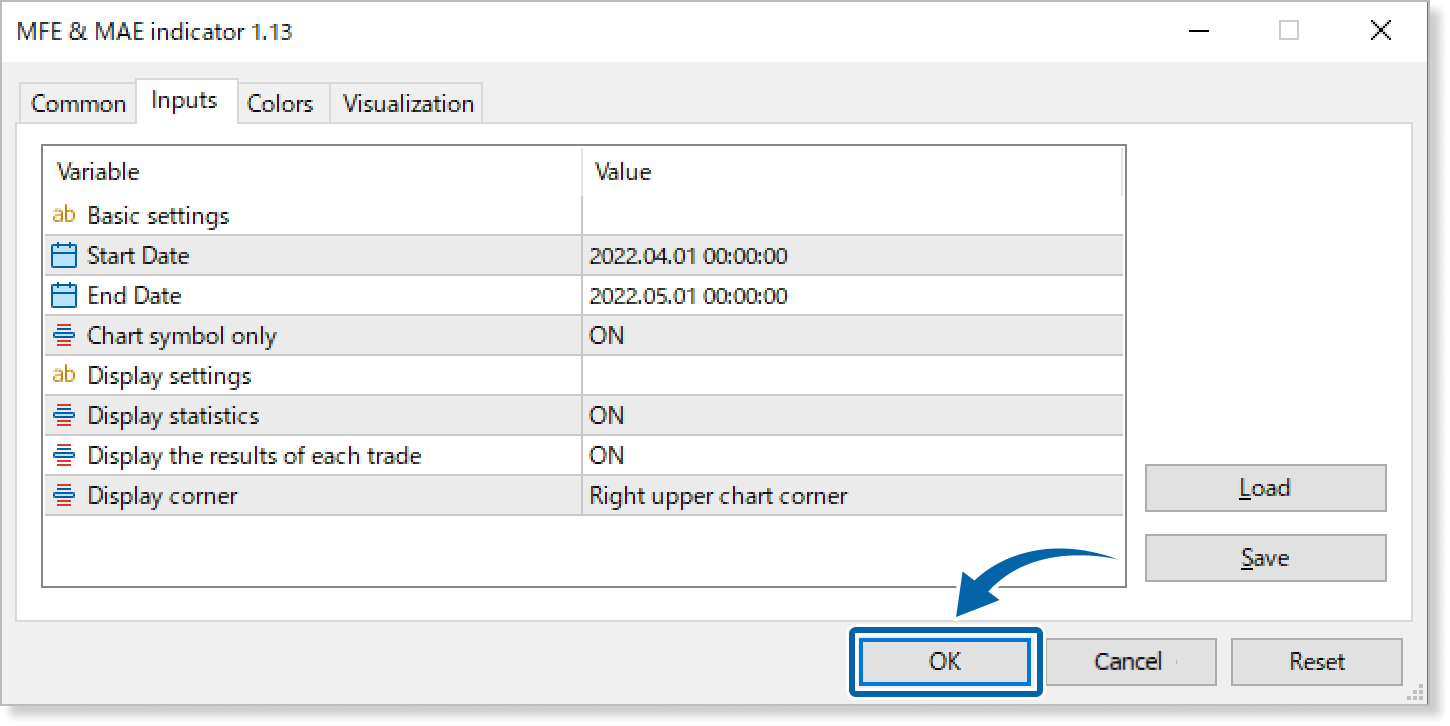
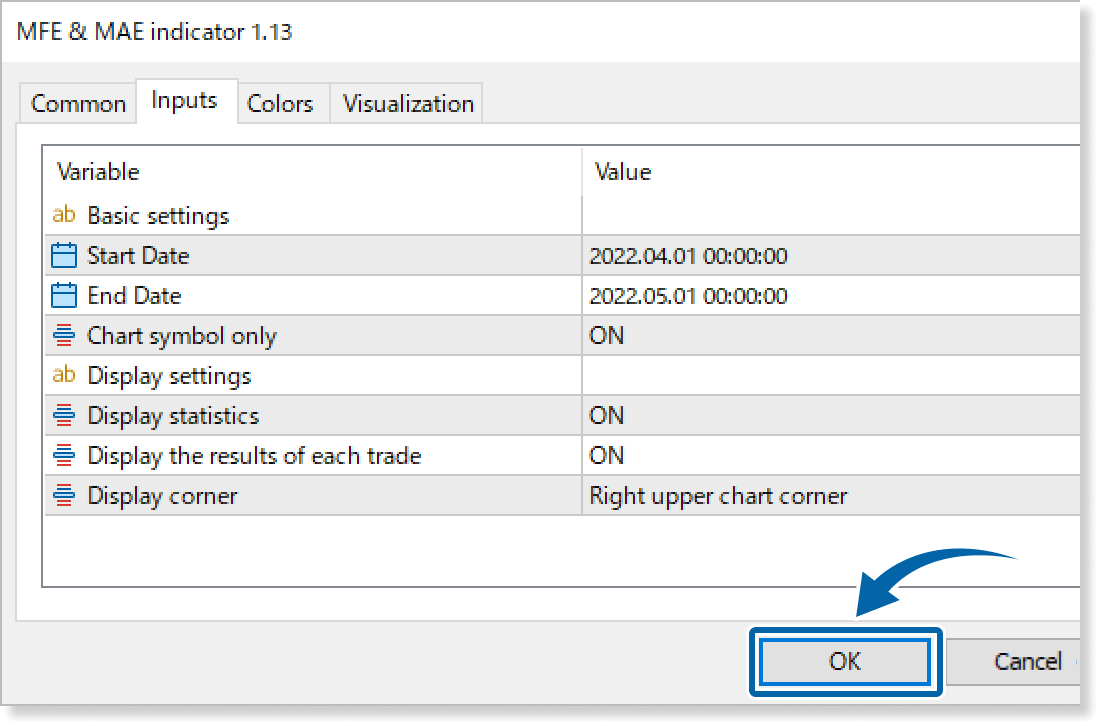
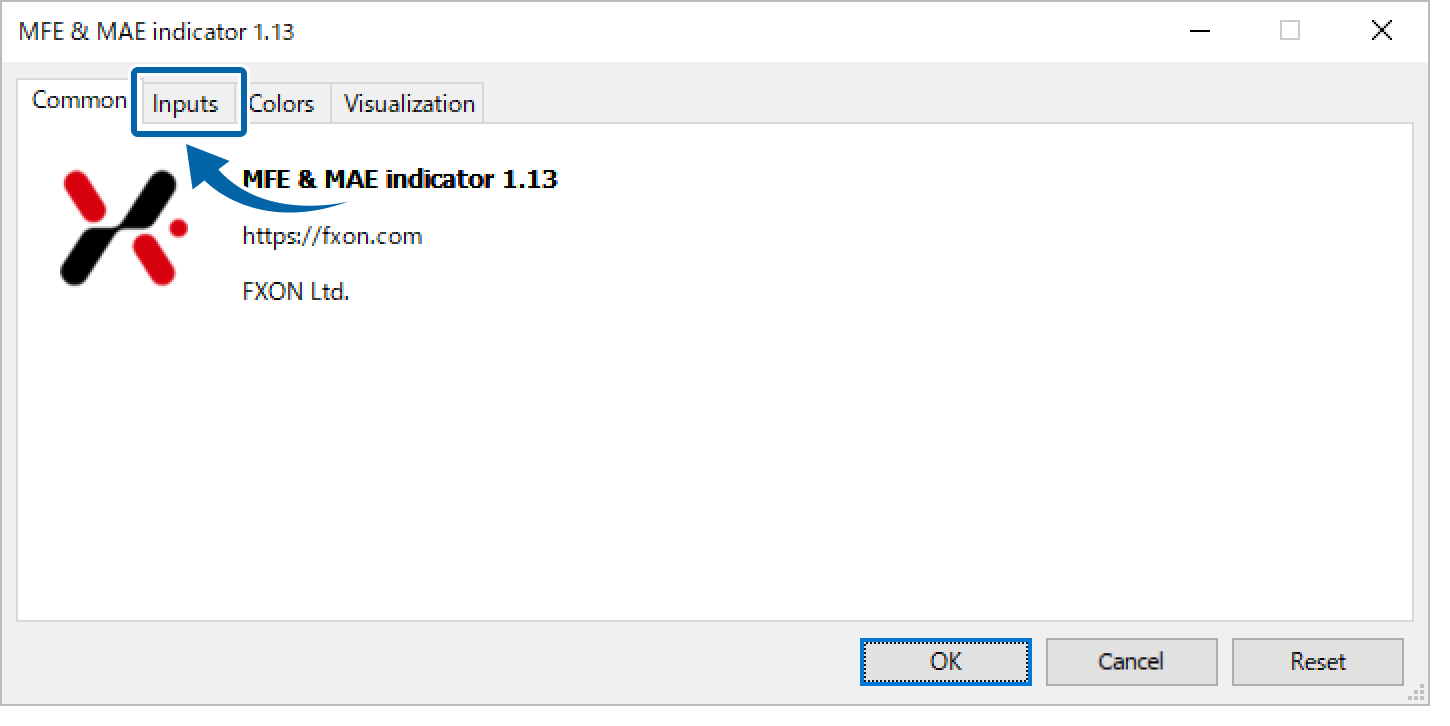
In the indicator settings window, customize the settings on the Inputs tab according to the How to set up page, then click OK.
Step 9
The MFE & MAE Indicator is applied to the chart, presenting the data on screen.

How to set up
After applying the indicator to the chart, set the parameters according to your style.
Step 1
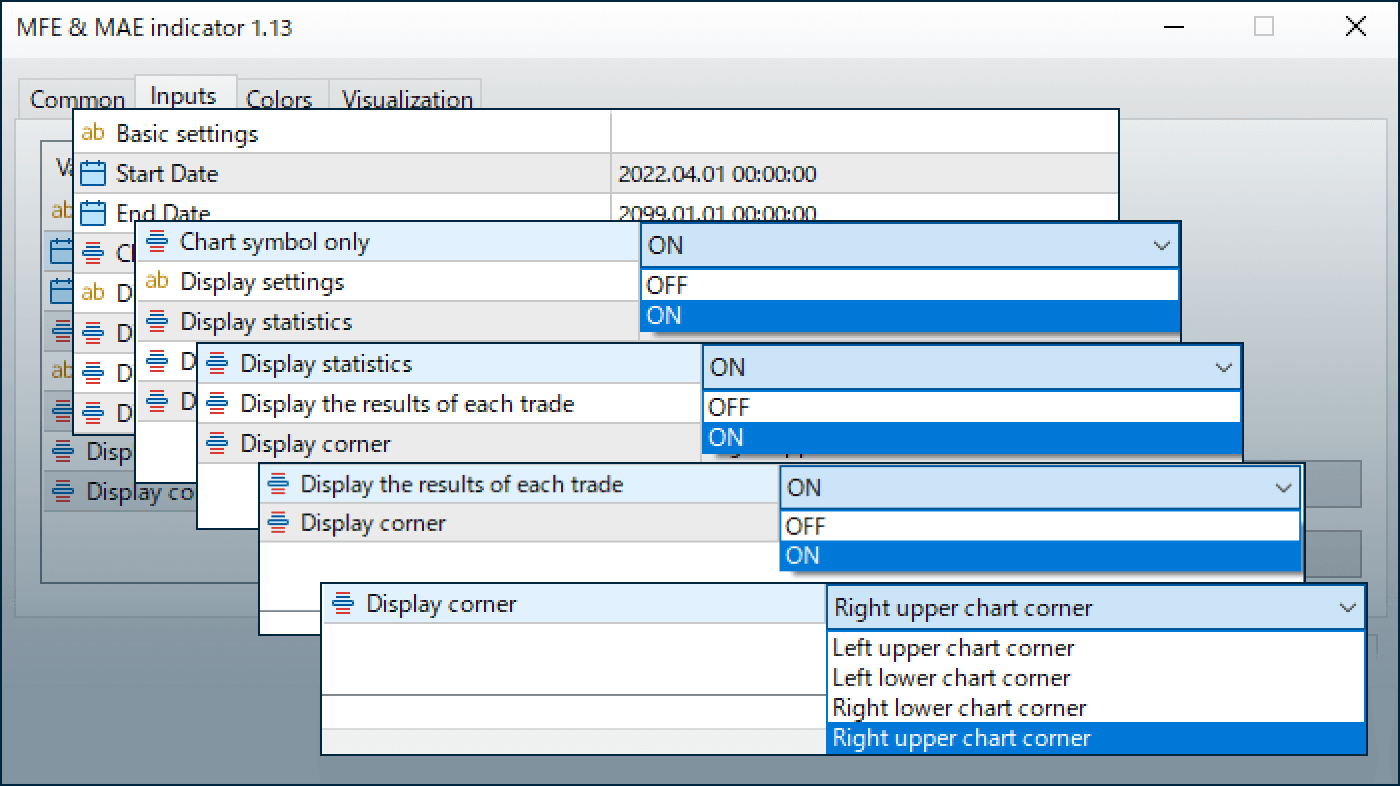
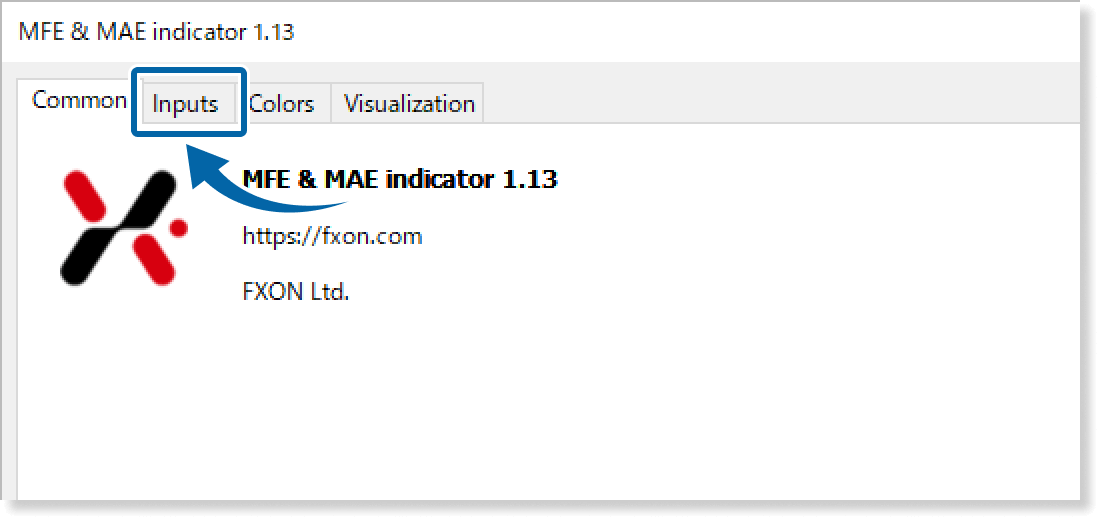
First, open the Inputs tab.
Step 2
Set the parameters as follows.
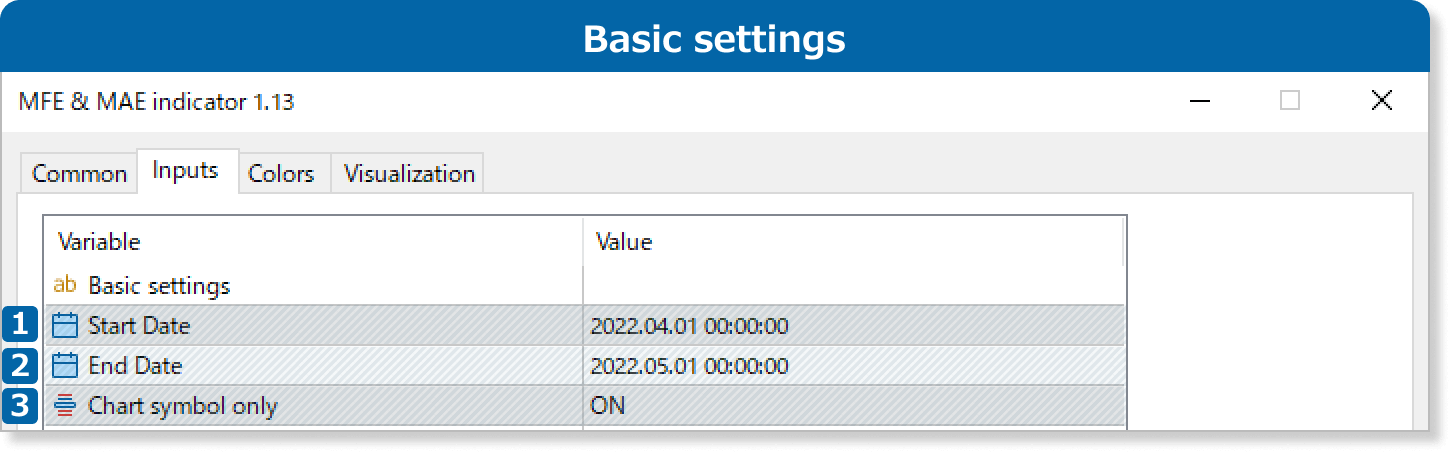
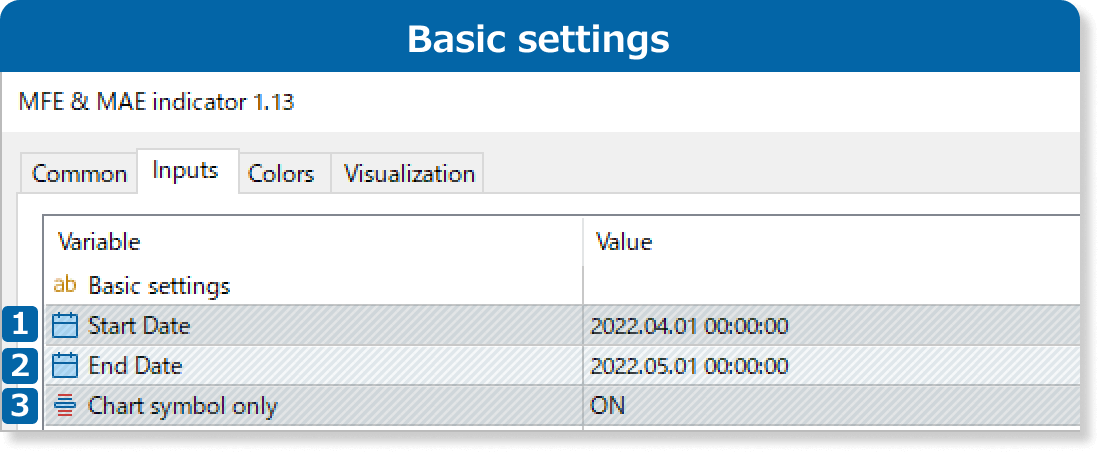
①Start Date
Specify the starting point of the period used for calculating MAE and MFE.
The input format is "YYYY.MM.DD HH:MM:SS". For example, to specify July 17, 2022, at 9:10:10 AM, enter: "2022.07.17 09:10:10".
②End Date
Specify the end point of the period used for calculating MAE and MFE.
The input format is "YYYY.MM.DD HH:MM:SS". For example, to specify November 7, 2022, at 7:07:07 AM, enter: "2022.11.07 19:07:07".
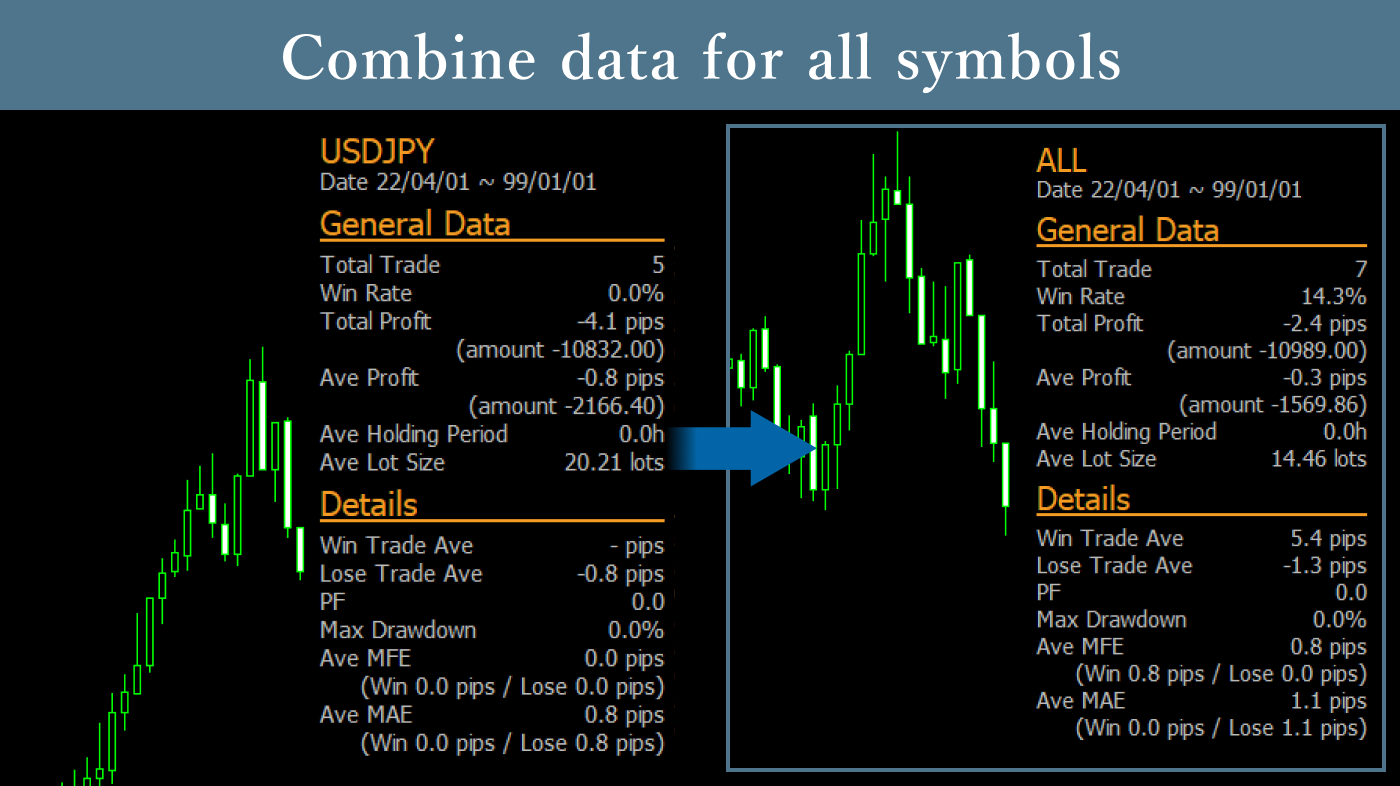
③Chart symbol only
If it is ON, MAE and MFE will be calculated only for the symbol displayed on the chart.
If it is OFF, the calculation will include all trades within the specified timeframe.
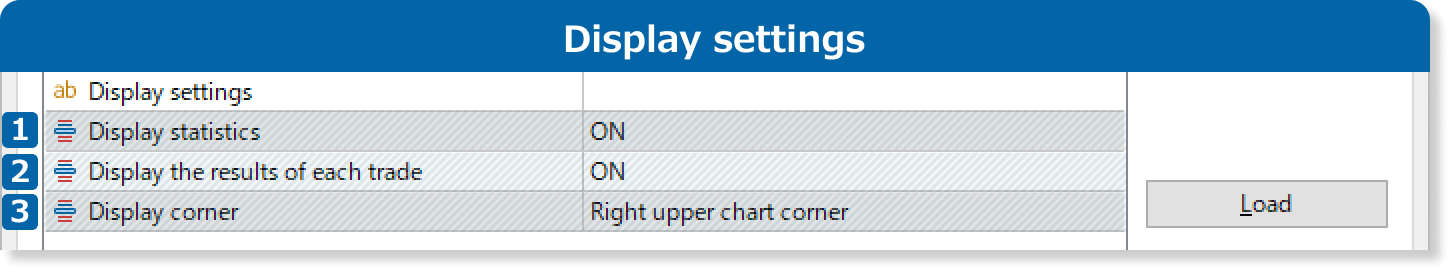
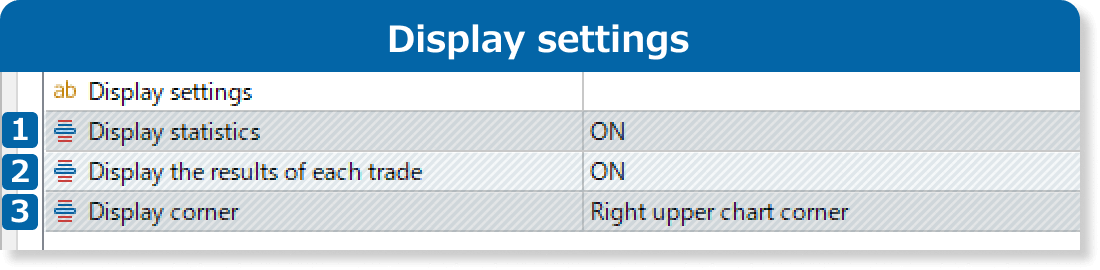
①Display statistics
If it is ON, the statistics will be displayed on the chart.
The data includes the period, general data, and details.
②Display the results of each trade
If it is ON, data for each trade will be displayed.
③Display corner
Choose the position for displaying statistics.
Left upper chart corner
Right upper chart corner
Left lower chart corner
Right lower chart corner