


#technical
#subchart

#technical
#subchart
Downloaded:
0
times
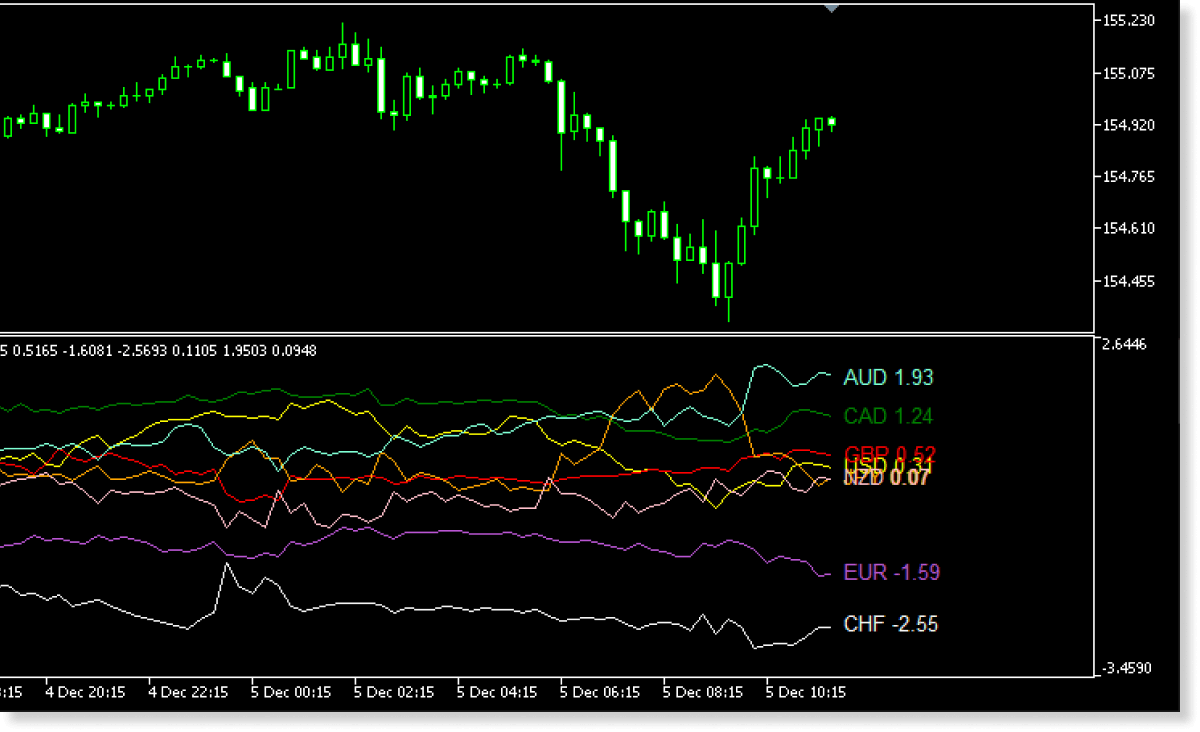
The Historical Strength Graph displays the strengths of eight major currencies, featuring real-time data and a historical line chart for a specified period.*1
*1Some users are experiencing issues when running custom indicators on MT5 build 5572 (released around February 1, 2026), including display errors and platform freezing. These problems can be resolved either by downgrading to build 5430 (or any earlier build) or by updating to the beta version. The latest beta version is available from the MT5 toolbar by navigating to Help > Check For Updates > Latest Beta Version.
Downloaded:
0
times
Usage scenarios
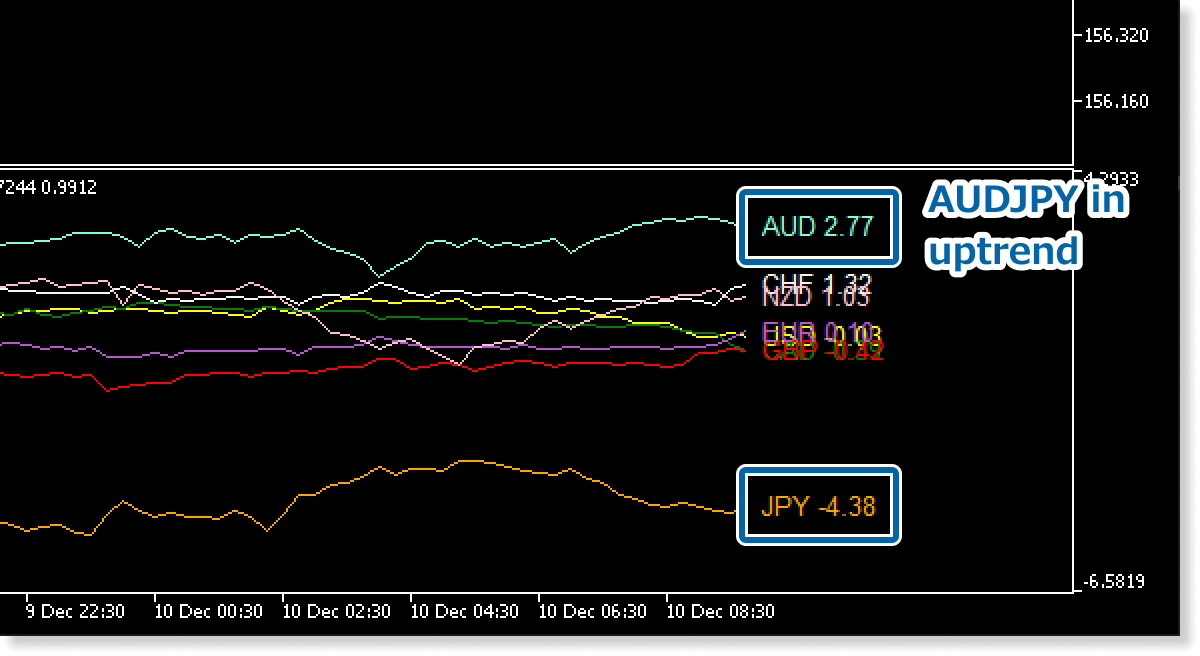
Trade the pair of the strongest and weakest currencies
One powerful way to use this tool is to trade the currency pair made up of the strongest and weakest currencies. When the base currency is stronger, the pair is more likely to be in an uptrend; when the quote currency is stronger, it may signal a downtrend. For example, if AUD is the strongest and JPY is the weakest, you could consider buying AUDJPY.
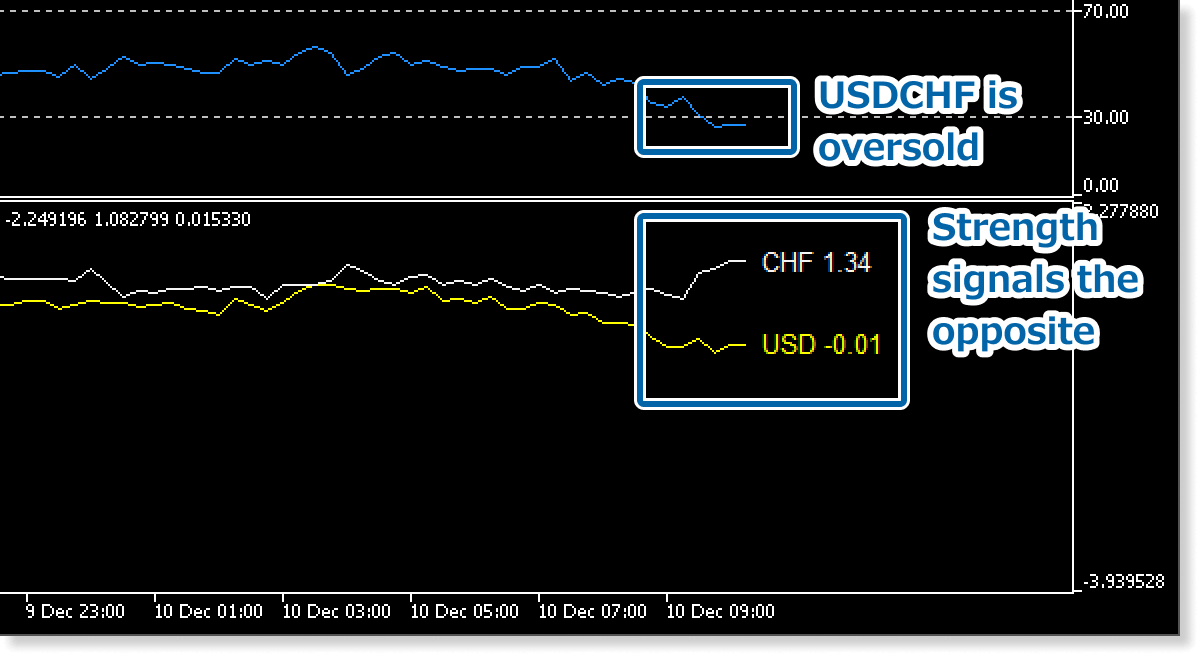
Determine entry points with other indicators
It is also useful for confirming entry signals generated by other indicators. Check whether the Historical Strength Graph supports the same direction before finalizing your entry. For example, even if the RSI suggests that USDCHF is oversold, you may choose to skip the trade if CHF is stronger than USD.
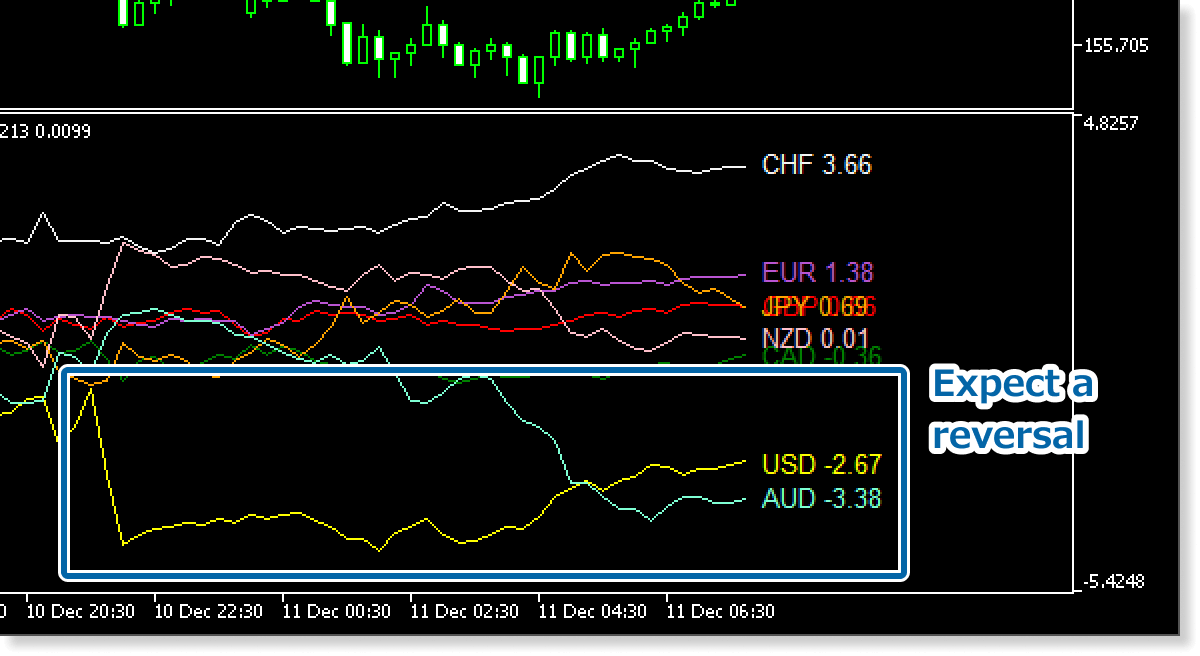
Look for reversals after major strength changes
Based on large movements in currency strengths, you can watch for potential reversals. If a currency’s strength value changes suddenly, a reversal may follow. In that case, consider looking for buy or sell opportunities in the related instruments.
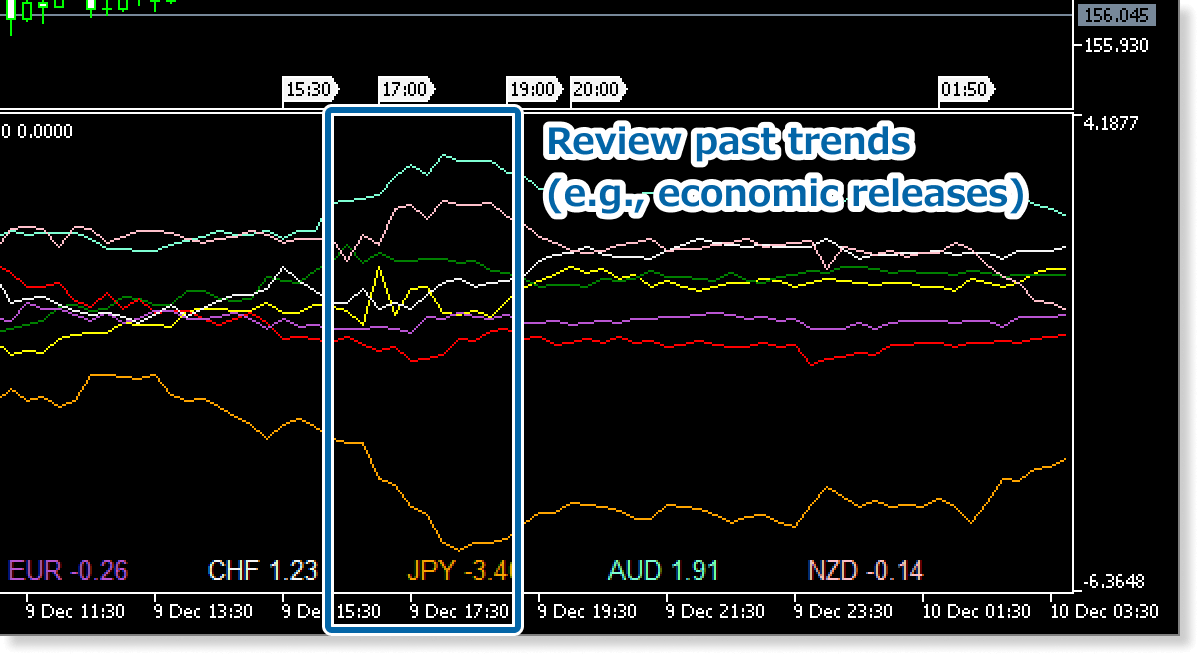
Sync with chart for backtesting
The Historical Strength Graph calculates and displays currency strengths based on the selected chart period. You can review your past trades by checking the currency strength levels at specific points in time.
How to install
To use the Currency Strength Indicator, follow the steps below to download and install it.
Step 1
Click the button below to download the indicator for MT4/MT5.
Step 2
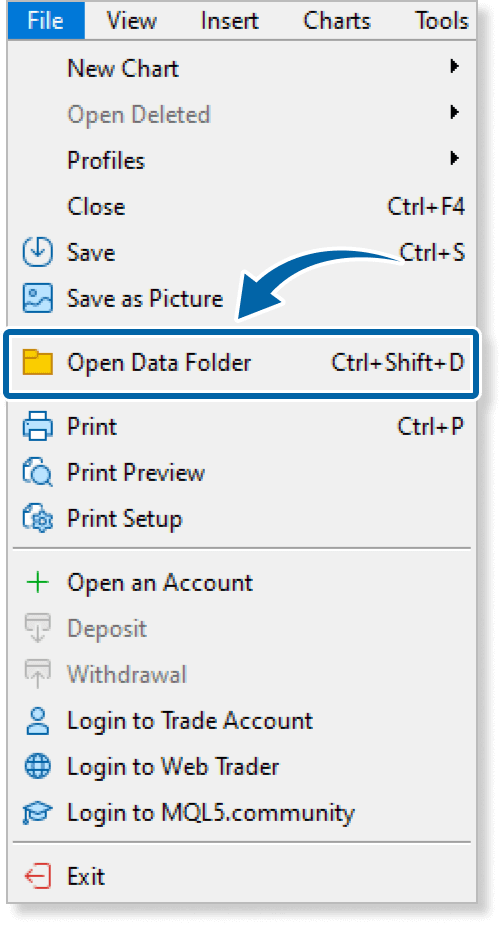
Click File > Open Data Folder in the top menu of MT4/MT5.
Step 3
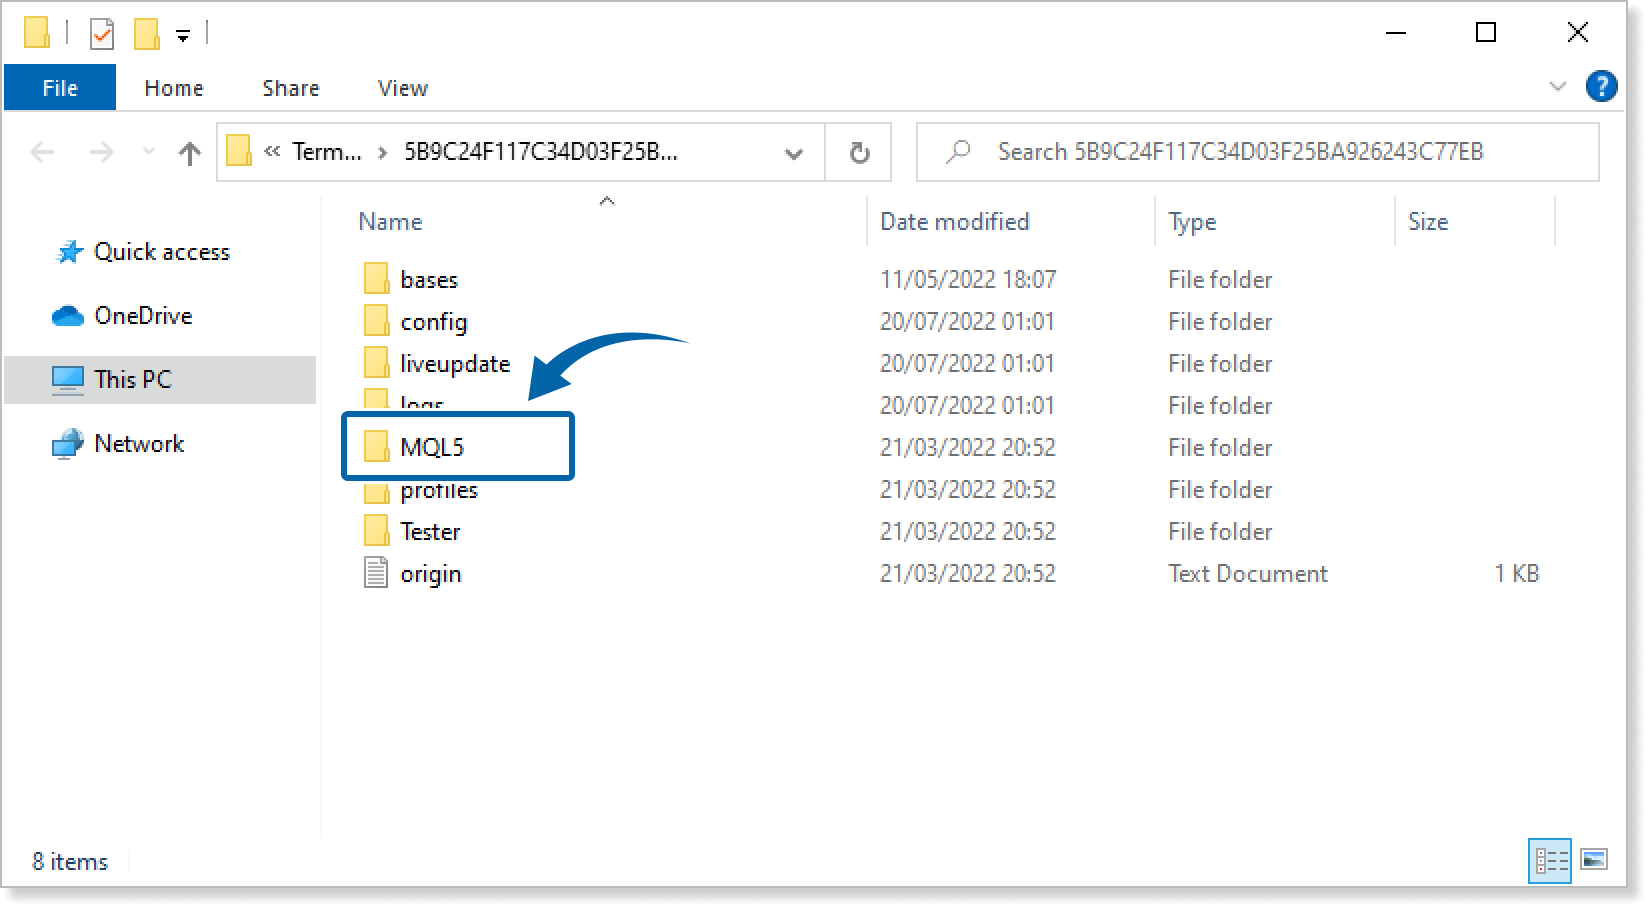
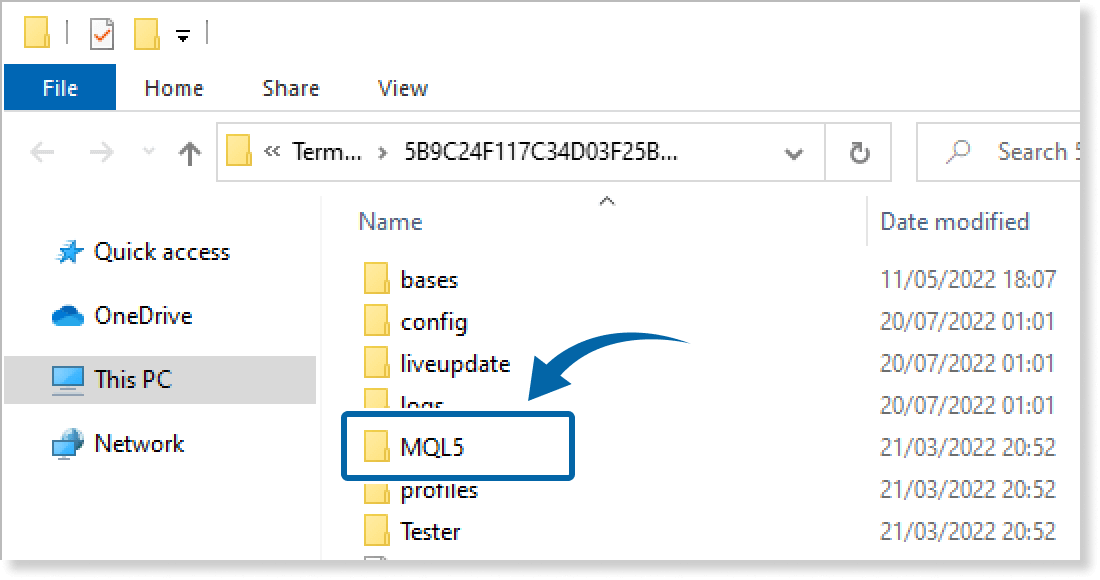
In the data folder, double-click the MQL4 or MQL5 folder.
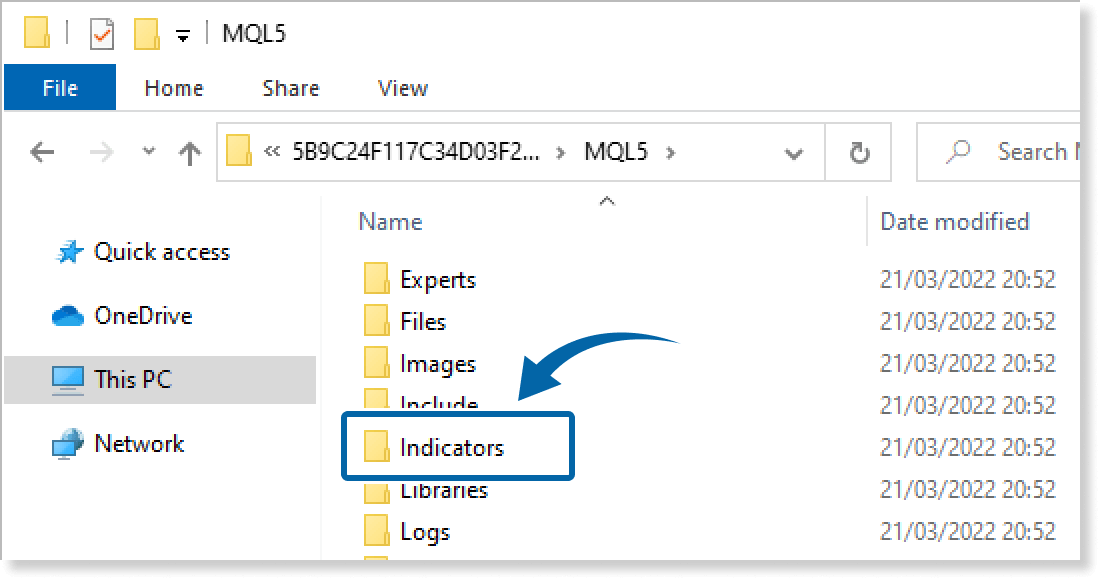
Step 4
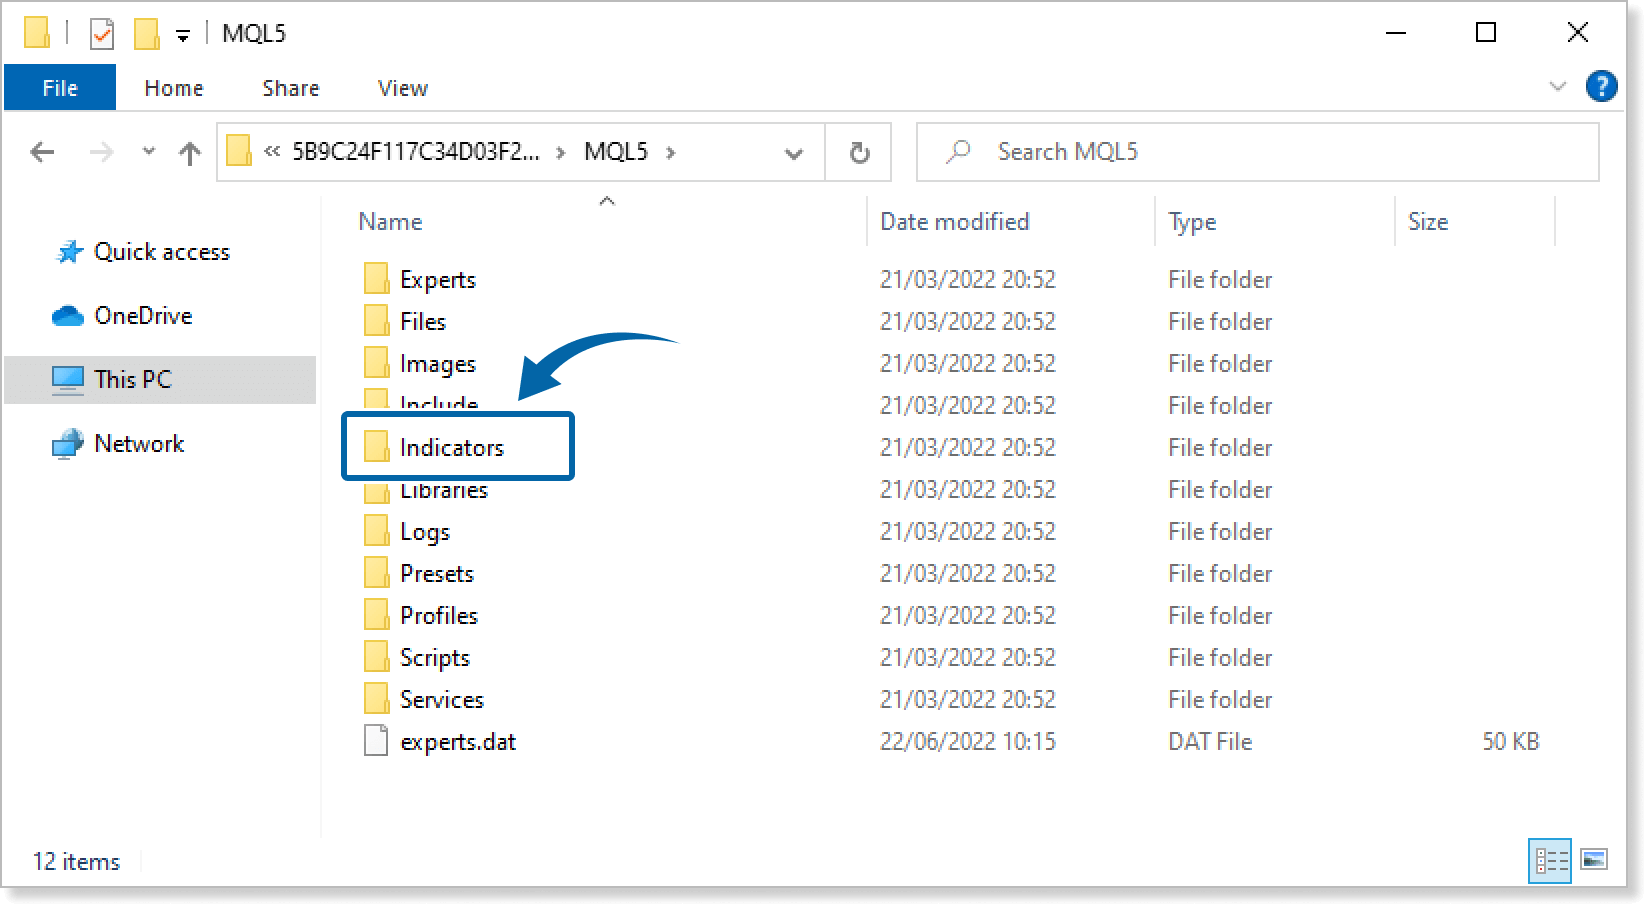
In the MQL4/MQL5 folder, double-click the Indicators folder.
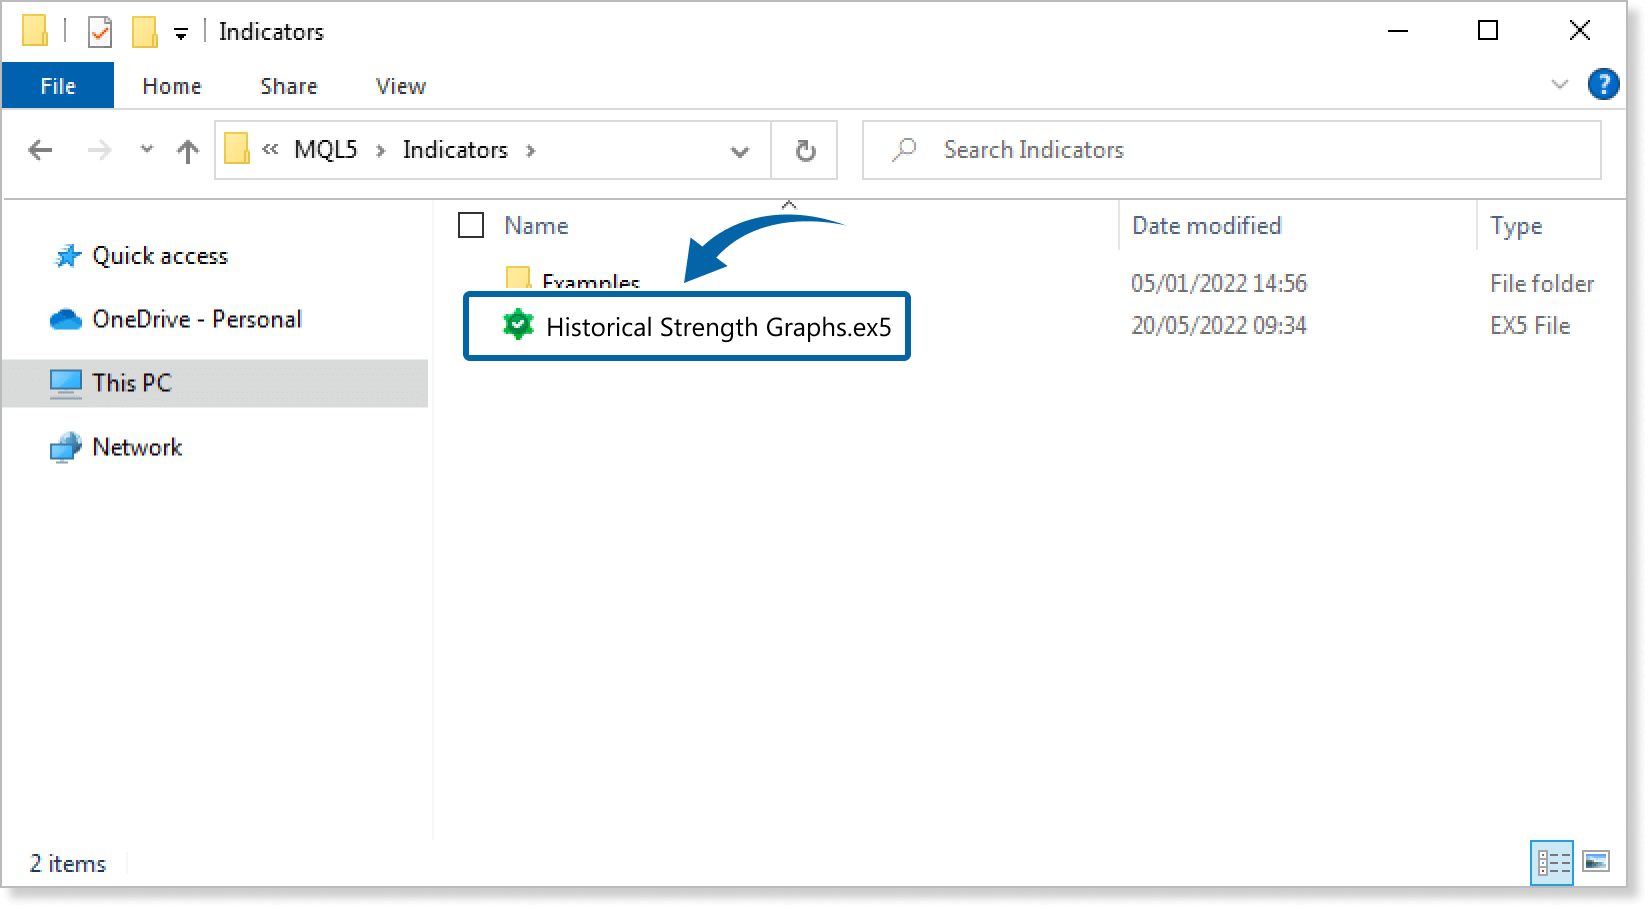
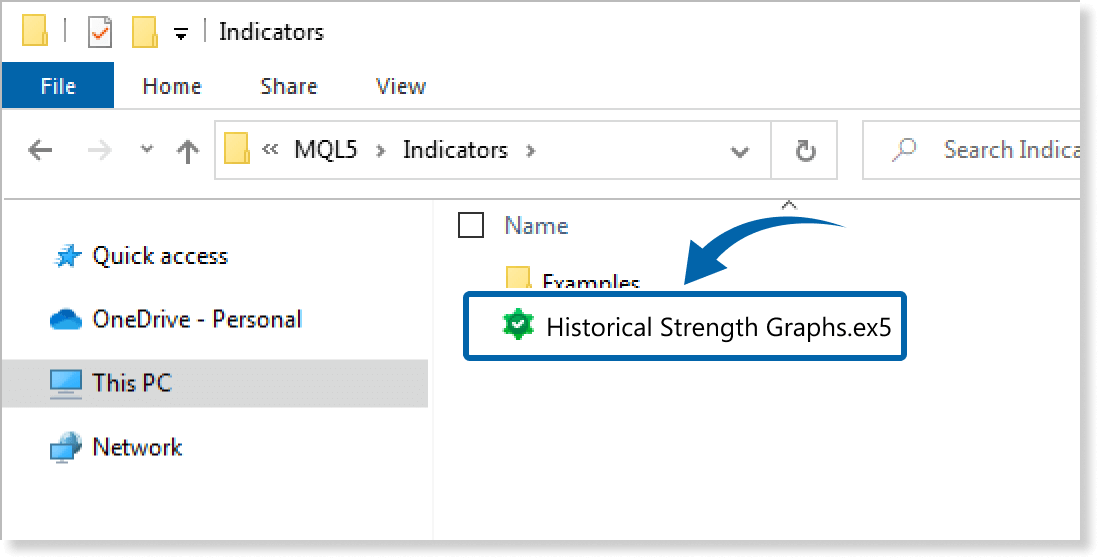
Step 5
Save the Historical Strength Graphs in the Indicators folder.
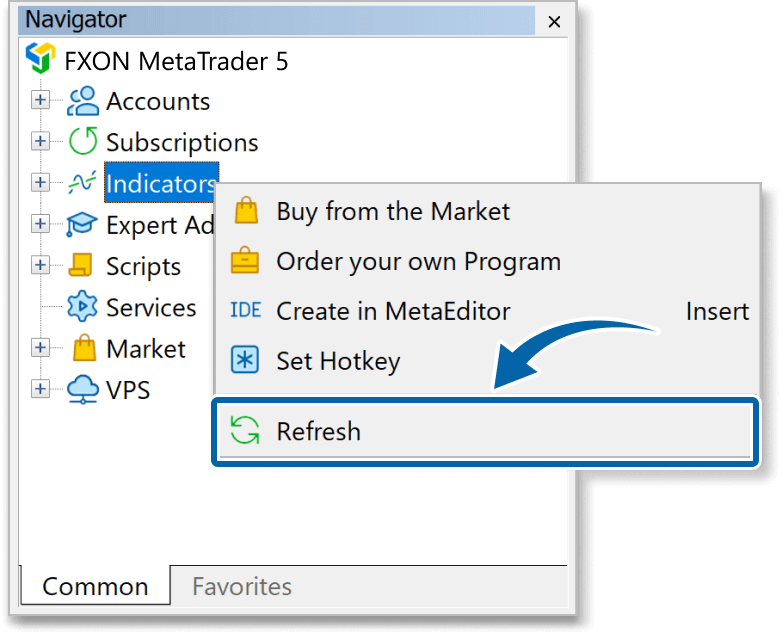
Step 6
Go back to the MT4/MT5. Right-click Indicators in the Navigator, and click Refresh.
Step 7
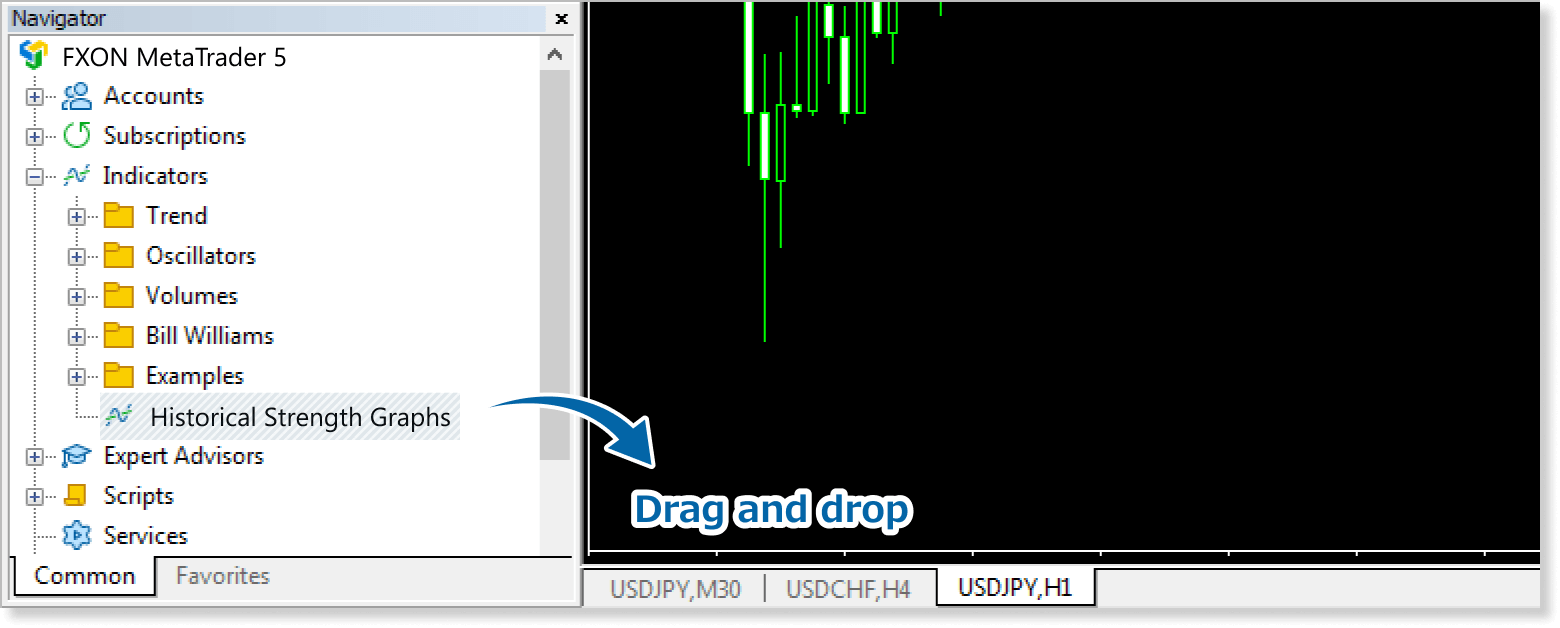
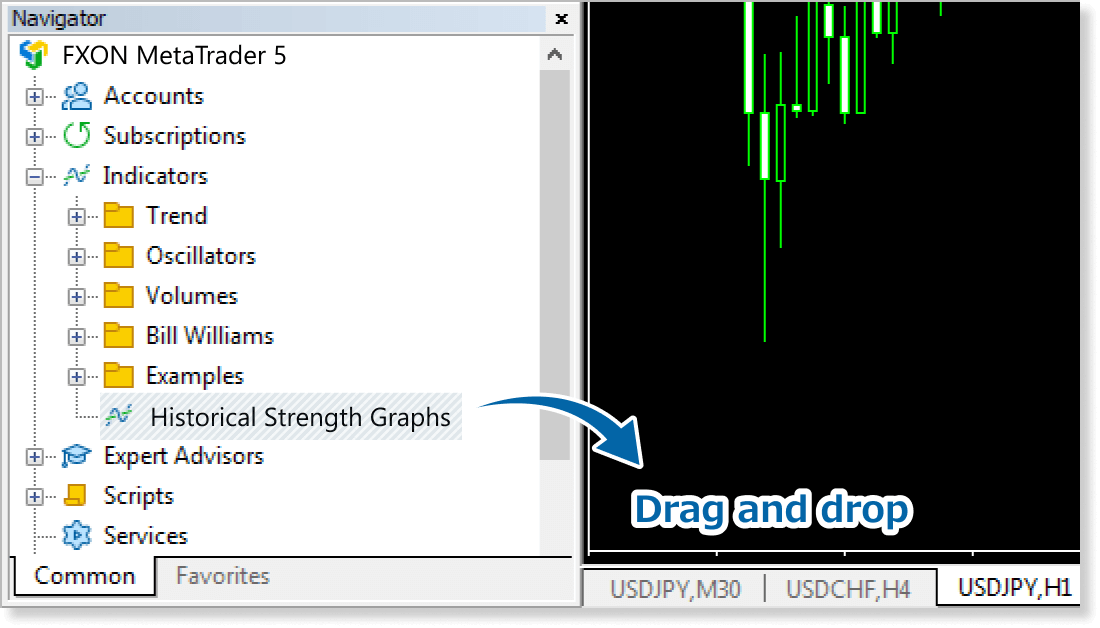
In the Navigator, click the + icon next to Indicators. Find the Historical Strength Graphs, then either double-click it or drag it onto a chart.
Step 8
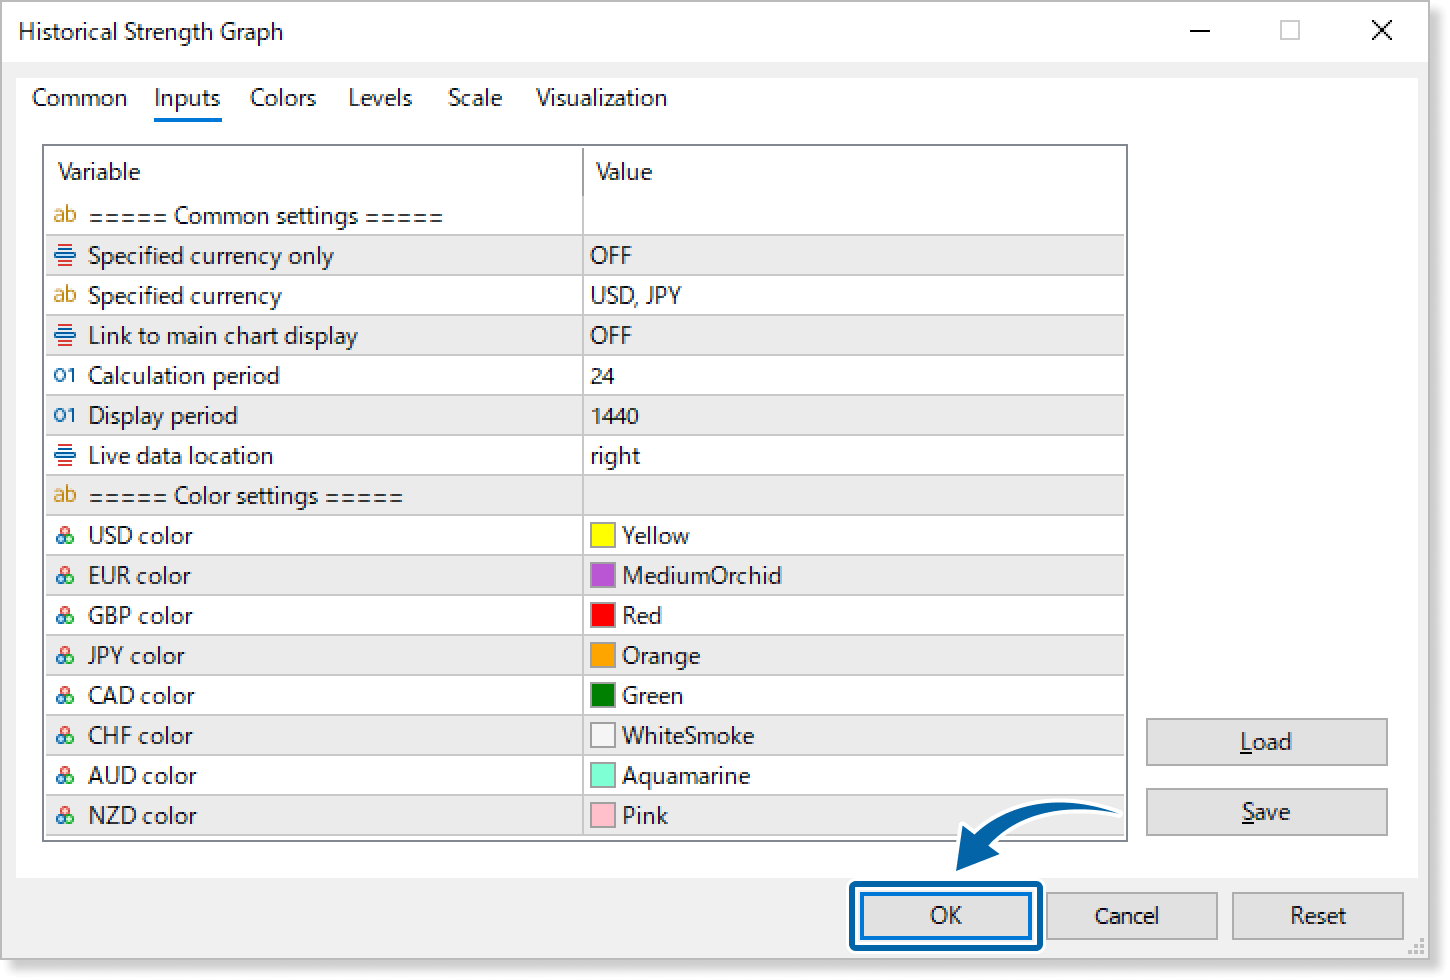
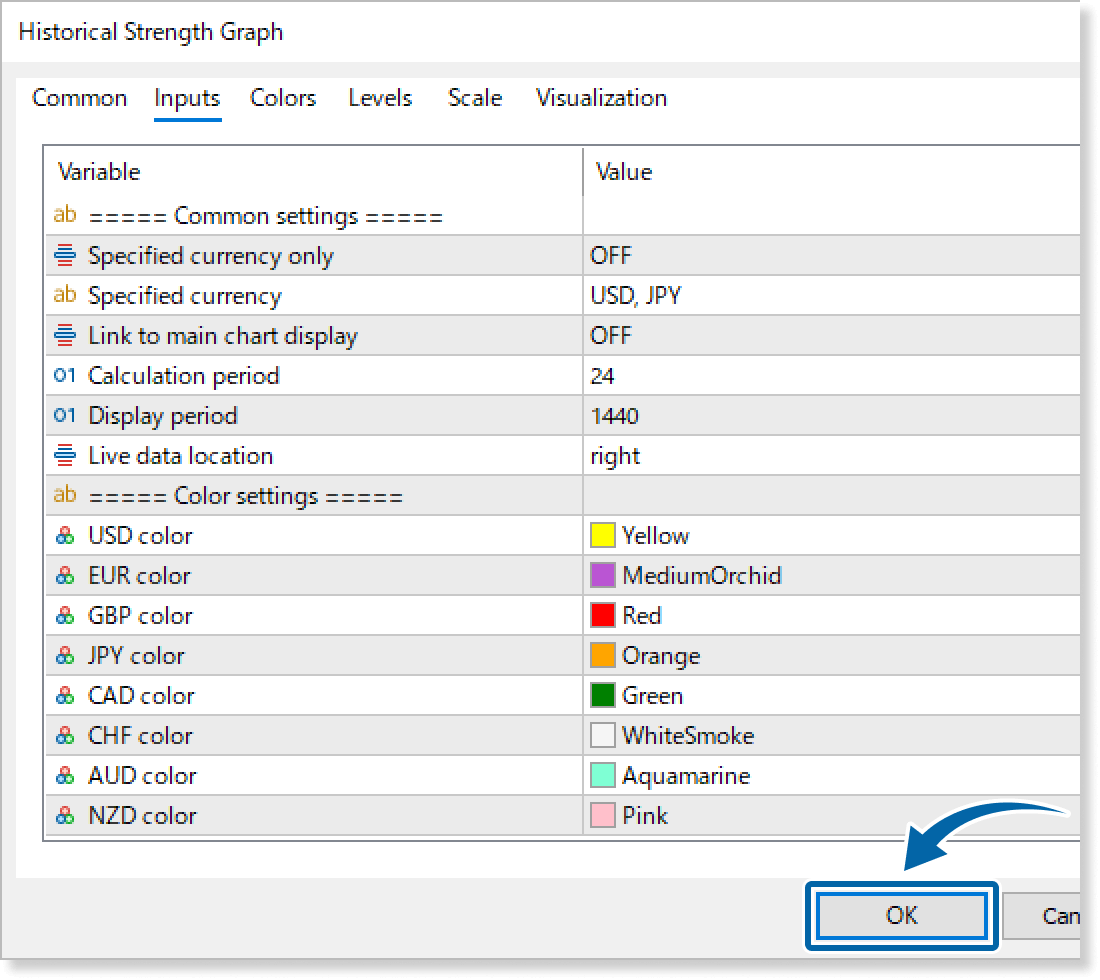
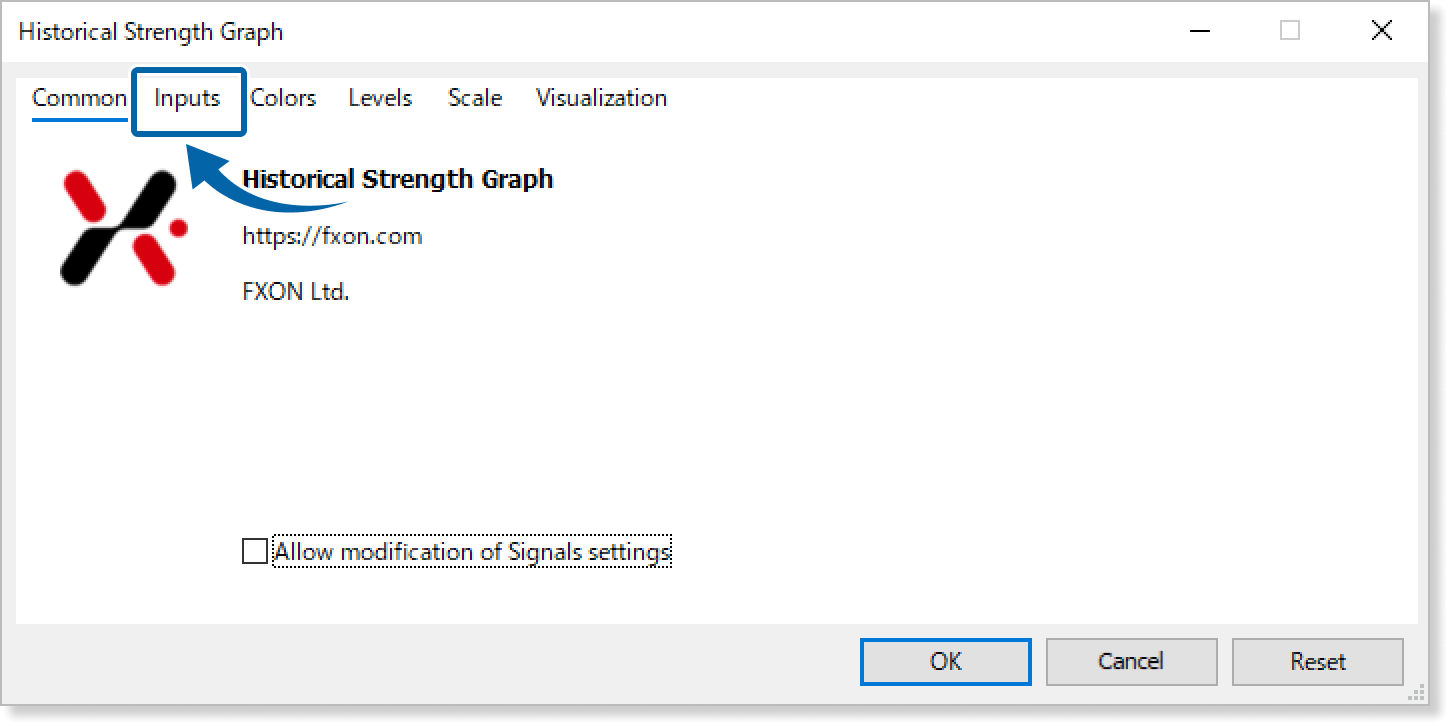
In the indicator settings window, customize the settings on the Inputs tab according to the How to set up page, then click OK.
Step 9
The Historical Strength Graph is applied to the chart, and the currency strengths is displayed in the subwindow.
Step 10
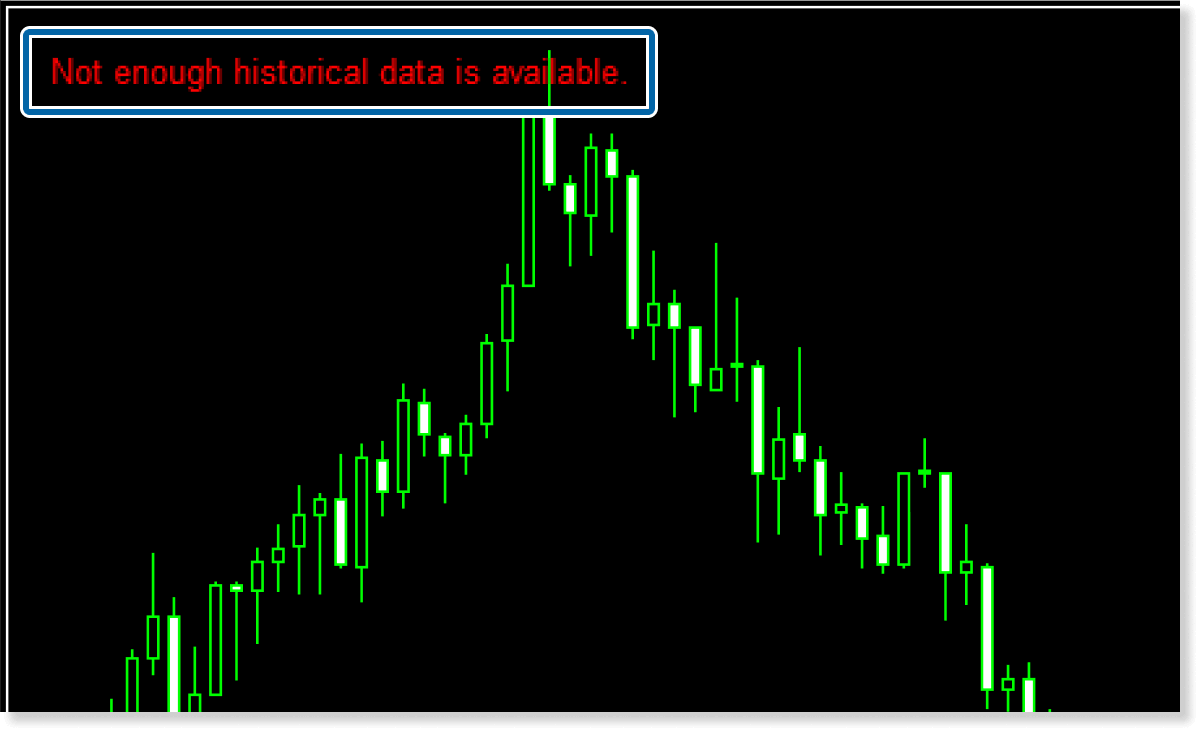
The Historical Strength Graph will trigger an alert sound and display a message on the chart if an error occurs, such as invalid parameter inputs. Check the message to identify the cause of the error.
The message is displayed as an object on the chart and can be deleted in the same way as other standard objects.
How to set up
After applying the indicator to the chart, set the parameters according to your style.
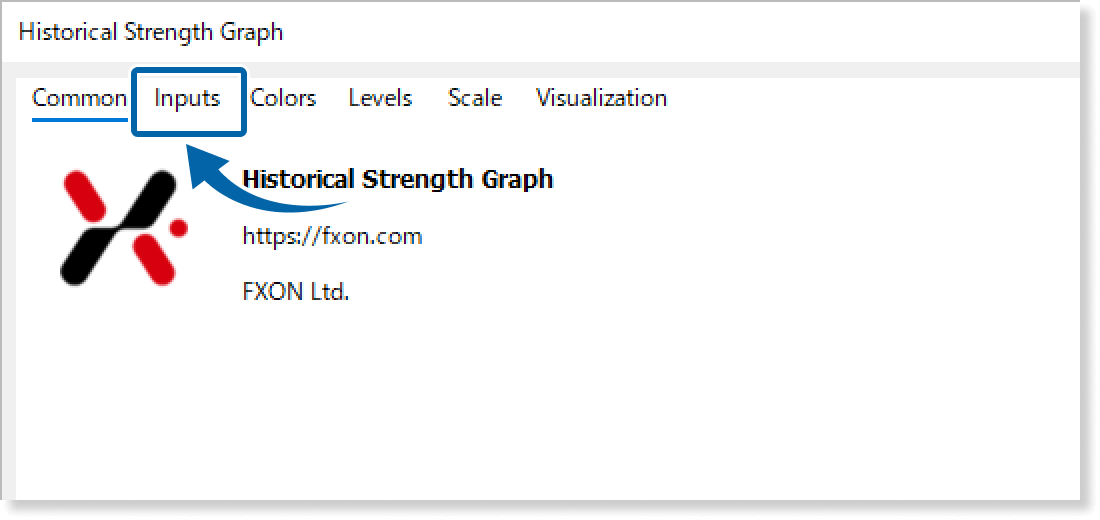
Step 1
First, open the "Inputs" tab.
Step 2
Set the parameters as follows.
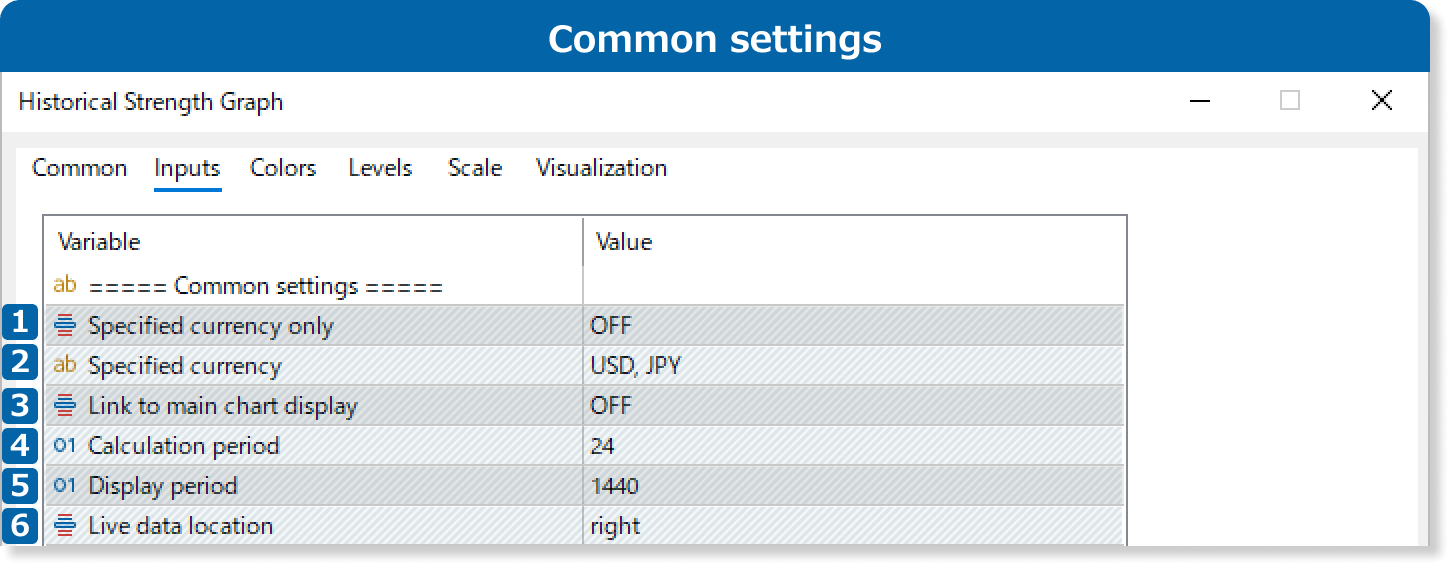
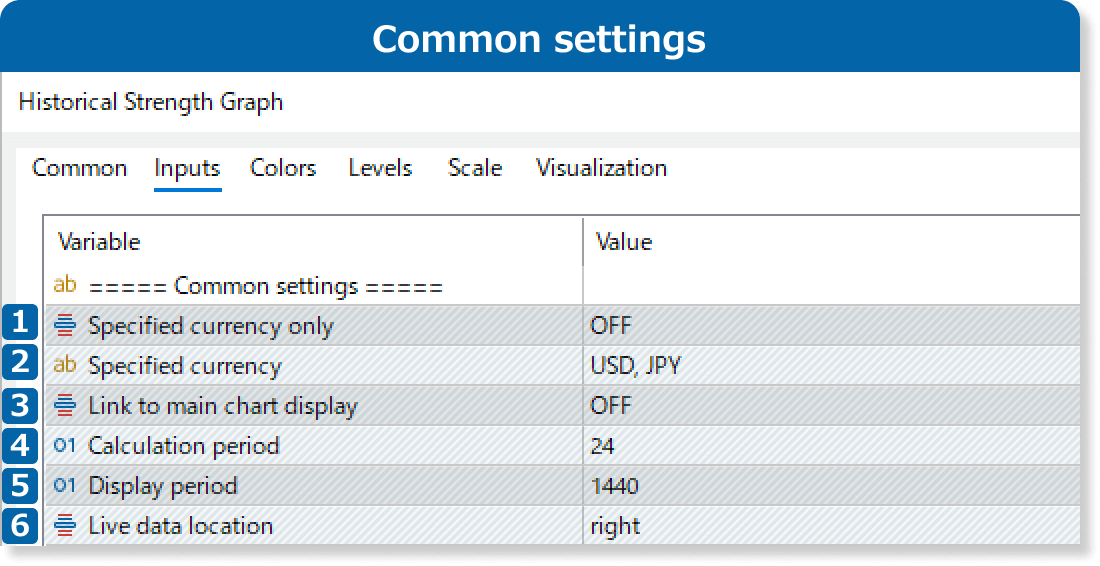
① Specified currency only
Select ON if you want to display only the line charts of the currencies defined in the "Specified currency" parameter.
② Specified currency
When "Specified currency only" is set to ON, it calculates strengths only for the currencies listed in this field. You can enter multiple currencies by separating them with commas. An error will occur if an unsupported currency or only a single currency is entered.
③ Link to main chart display
Select ON to automatically adjust the range of strength data to align with the display of the main chart.
④ Calculation period
Enter the number of hours for calculating past strength data. For example, entering "10" will calculate strengths over the past 10 hours. An error will occur if the value is smaller than the duration of one bar or excessively large.
⑤ Display period
Set the number of bars of past strength data to display. For example, entering "12" on a 15-minute timeframe will show data from the past 3 hours. If the value exceeds the "Max bars in chart" setting in MT4/MT5, an error will be returned.
⑥ Live data location
Choose where to display the current strength data: right, top, or bottom.
The Historical Strength Graph calculates currency strengths for the period defined in the “Calculation period” parameter. Large values (e.g., ~10,000) may slow the downloading of historical data, causing delayed chart loading.
Very large values (e.g., ~100,000) may cause a timeout error. The tool will still work if you download the missing data or re-apply the indicator until the download completes. Please note that complete data for all symbols used in the currency strength calculation is required.
Because MT4 has lower processing power than MT5, delays or errors may occur even with smaller "Calculation period" values.
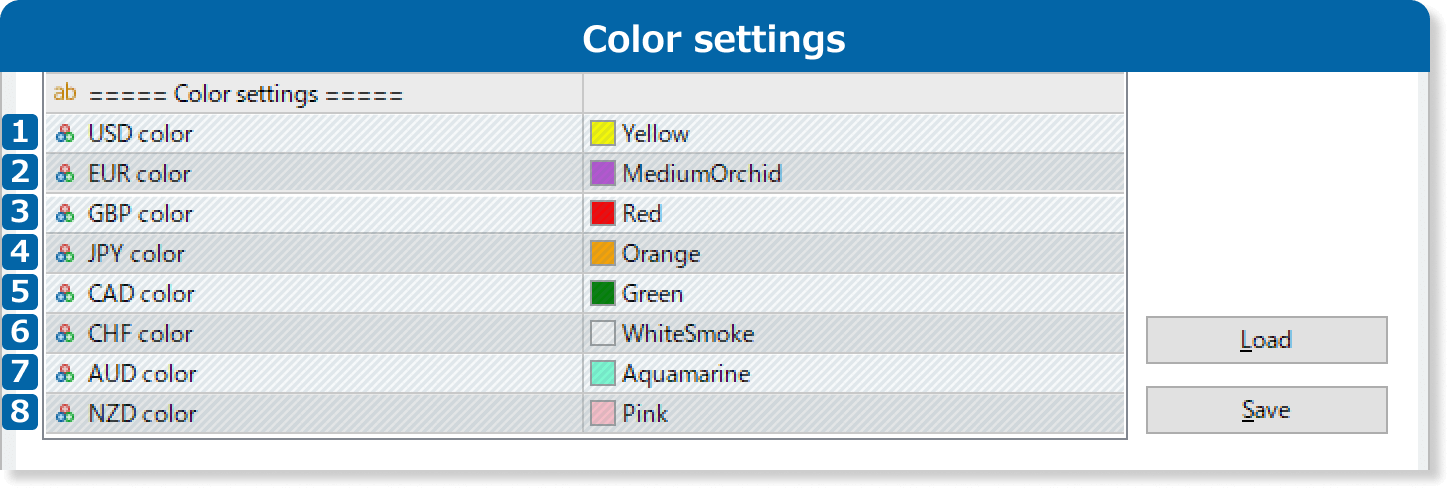
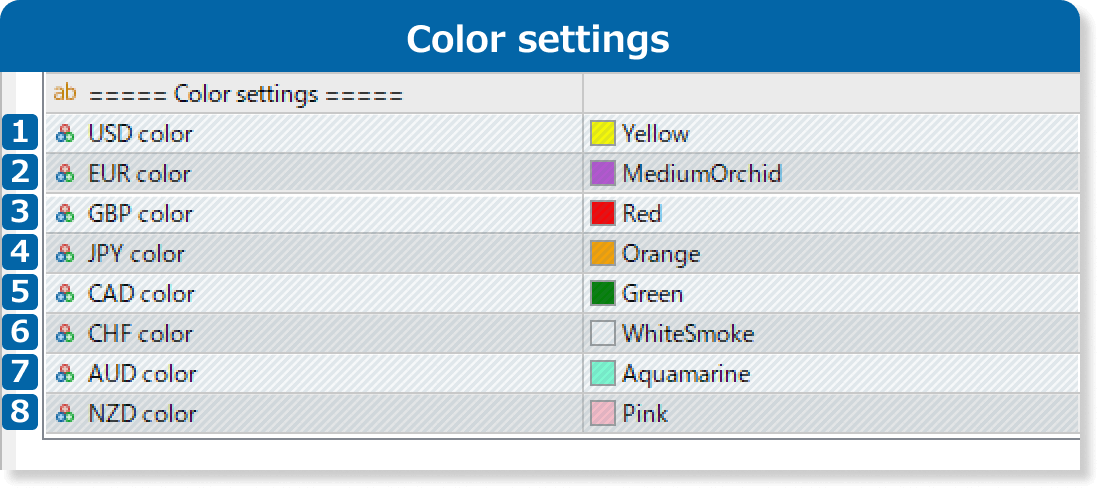
① USD color
Set the color for USD strength and chart.
② EUR color
Set the color for EUR strength and chart.
③ GBP color
Set the color for GBP strength and chart.
④ JPY color
Set the color for JPY strength and chart.
⑤ CAD color
Set the color for CAD strength and chart.
⑥ CHF color
Set the color for CHF strength and chart.
⑦ AUD color
Set the color for AUD strength and chart.
⑧ NZD color
Set the color for NZD strength and chart.