#supportive
#mainchart
#supportive
#mainchart
Downloaded:
0
times
The Chart Shift Tool is an indicator that synchronizes multiple charts and displays reference lines at the same date and time position. It is mainly useful when verifying your trading methods using historical charts. Since it can synchronize charts of different securities and timeframes, it makes it easy to compare and verify correlations between securities and timeframes.
Downloaded:
0
times
Usage scenarios
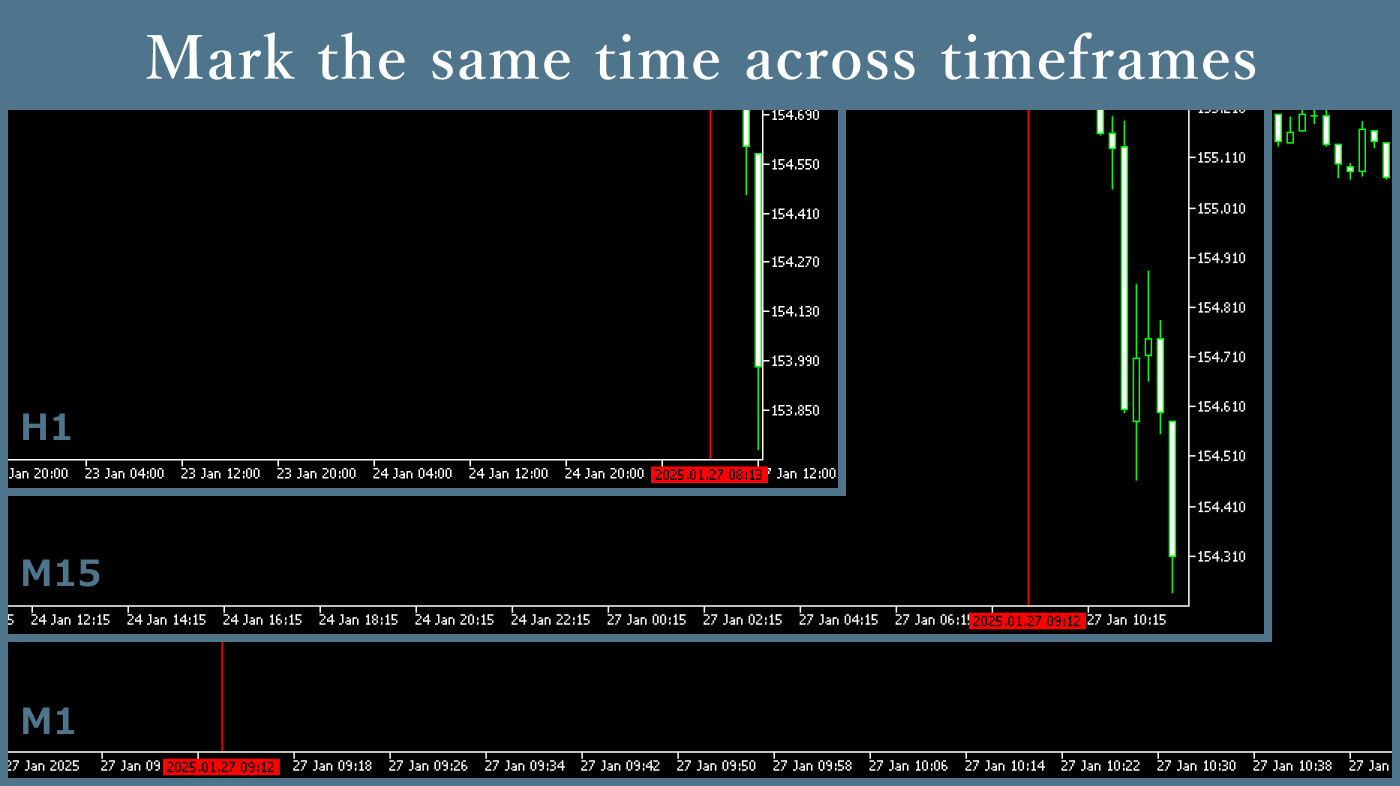
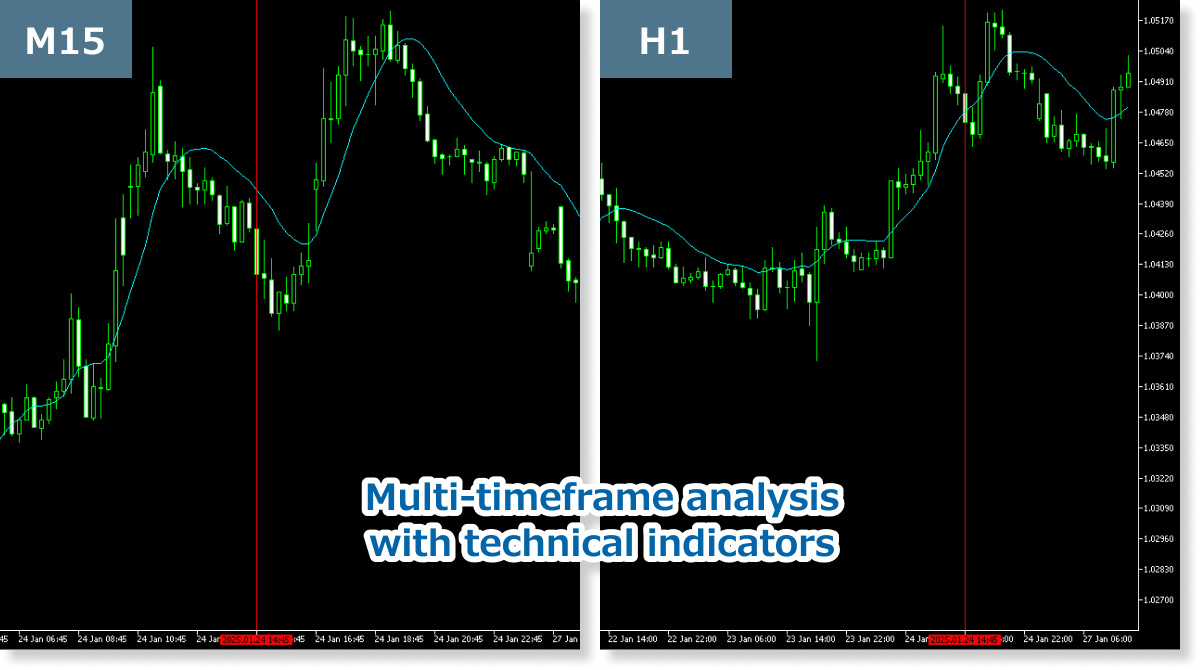
For multi-timeframe analysis
When displaying multiple charts with different timeframes, drawing a reference line with the Chart Shift Tool at the time where you want to verify your trading strategy makes it easier to understand the relationship between higher and lower timeframes, facilitating multi-timeframe analysis.
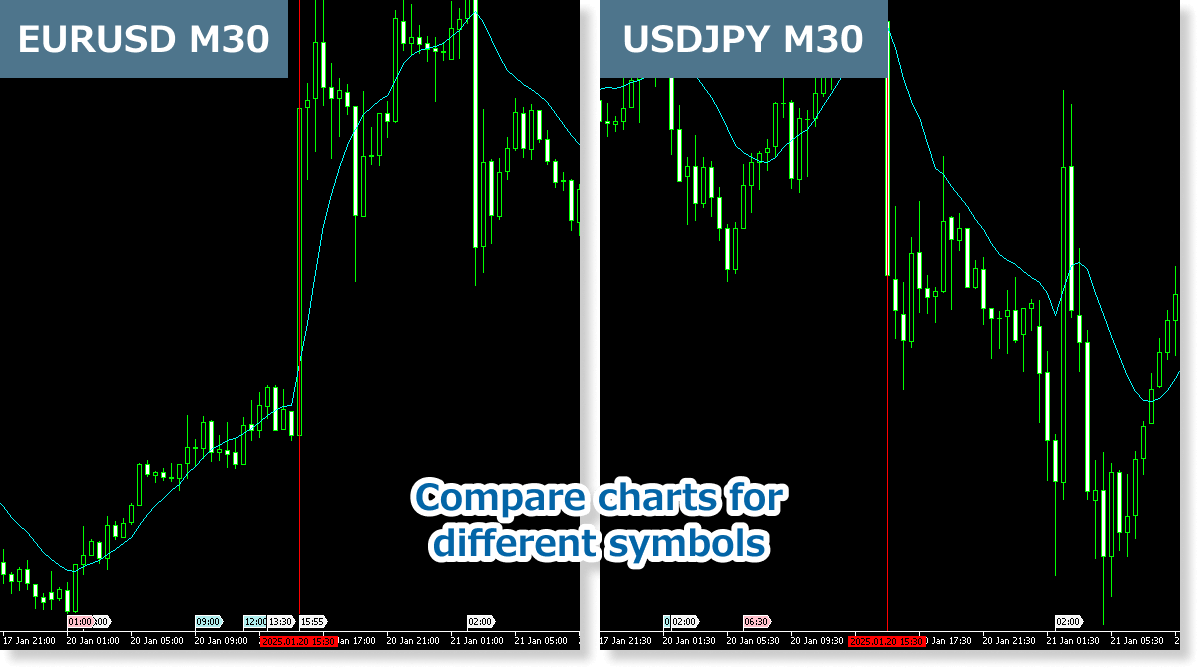
Checking price movement correlations between symbols
You can also use it to check price movement correlations between different symbols by displaying multiple charts and using the Chart Shift Tool. For example, you can draw reference lines at past economic indicator release times and analyze how each symbol’s price moved from that point, which can be useful for future trading.
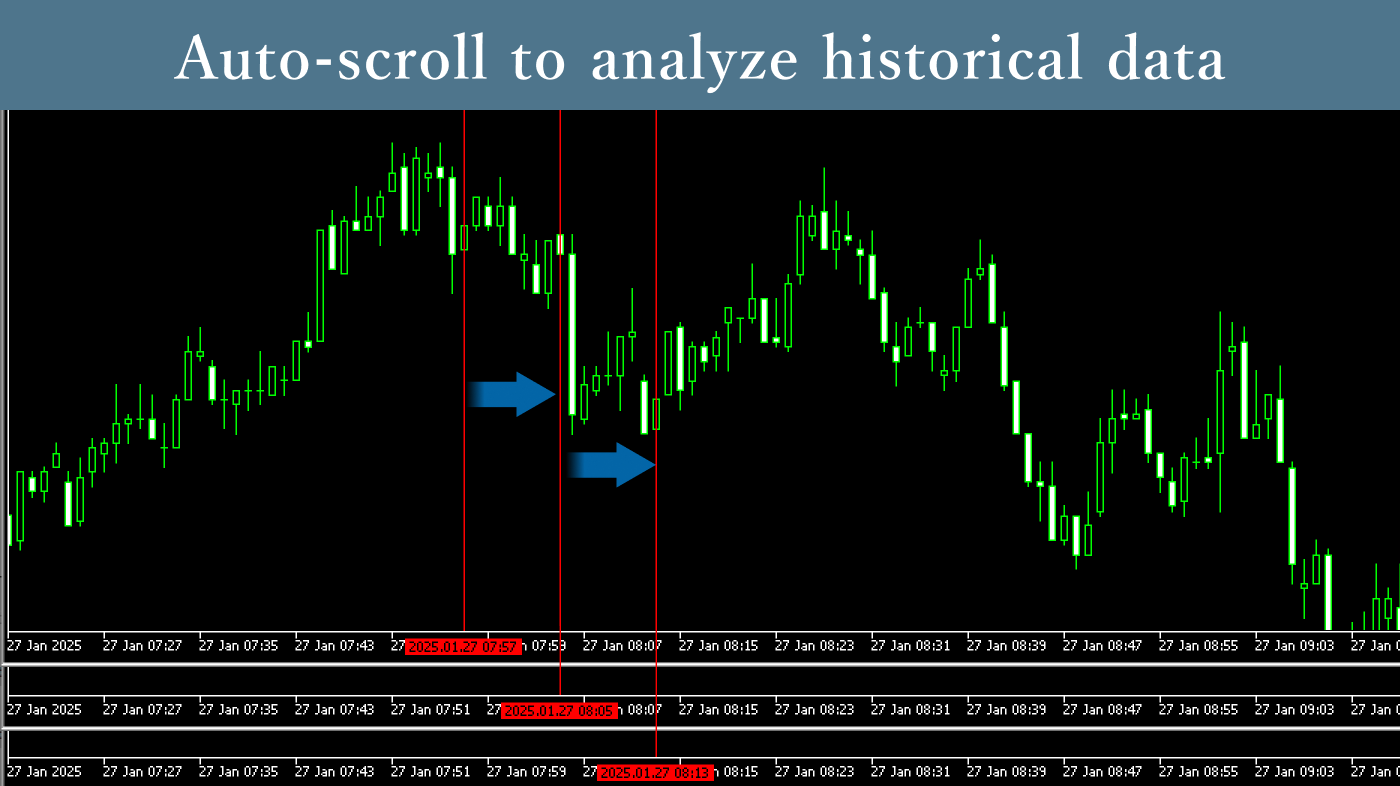
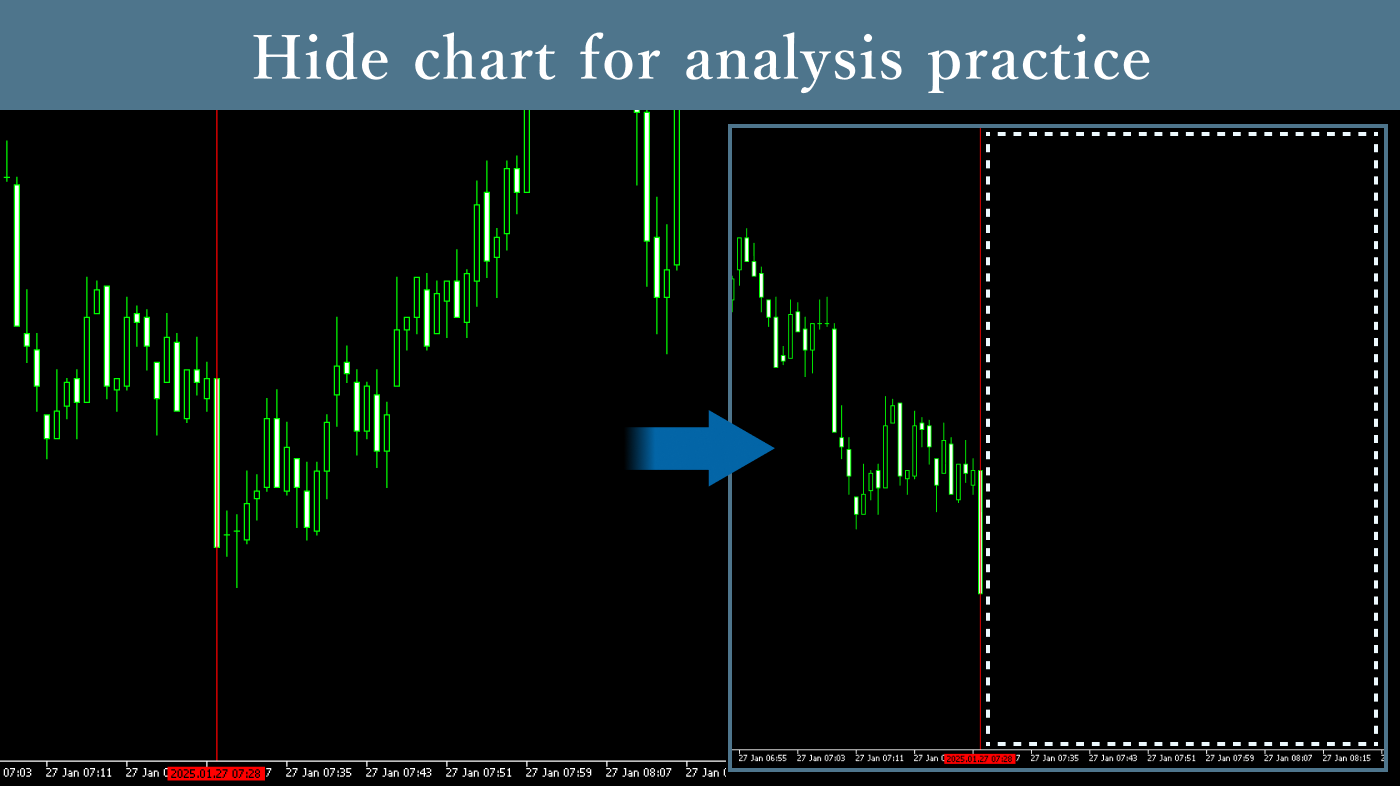
Practice trading using the auto-scroll
Using the Chart Shift Tool’s auto-scroll function, you can automatically advance the chart little by little from a point in the past while hiding future price movements. This can be used to practice trading using historical charts.
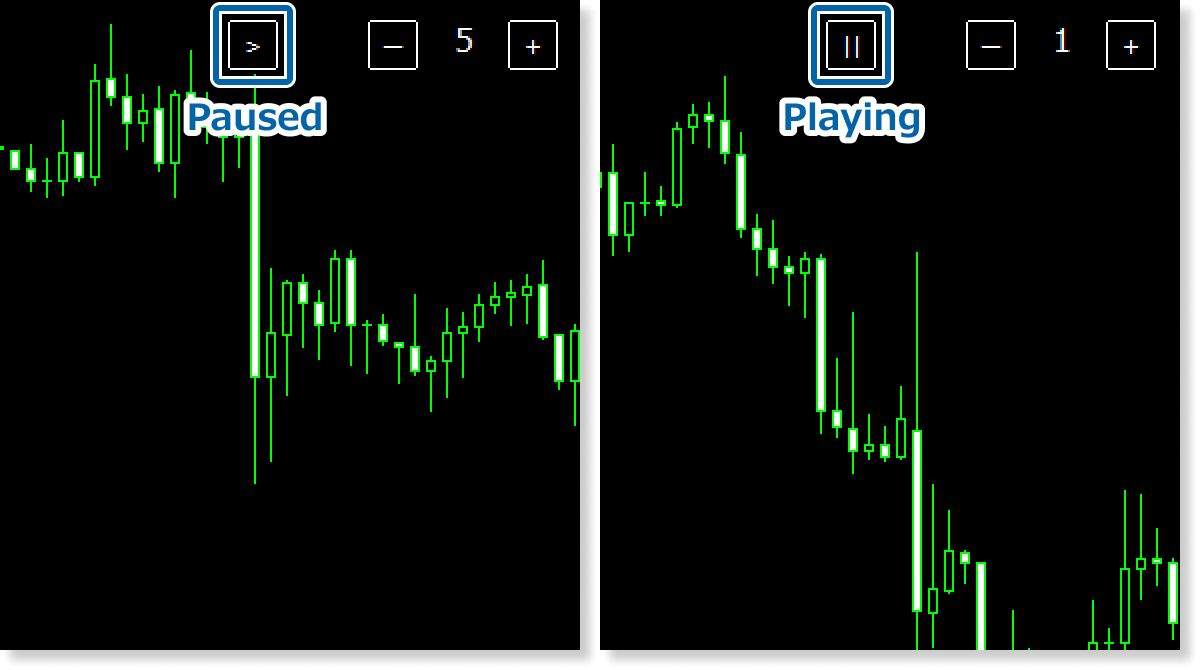
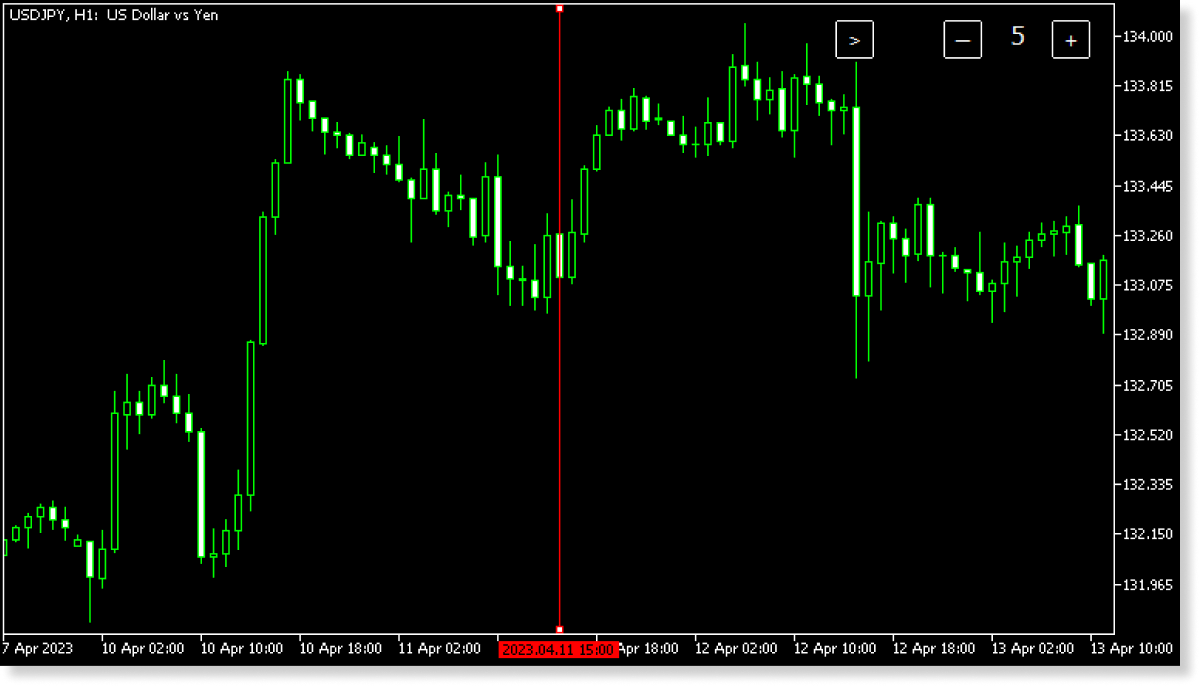
Auto-scroll function playback, stopping, and scroll speed changes can only be performed on the master chart. Reference line movement by the auto-scroll function is reflected in all charts where the Chart Shift Tool is applied.
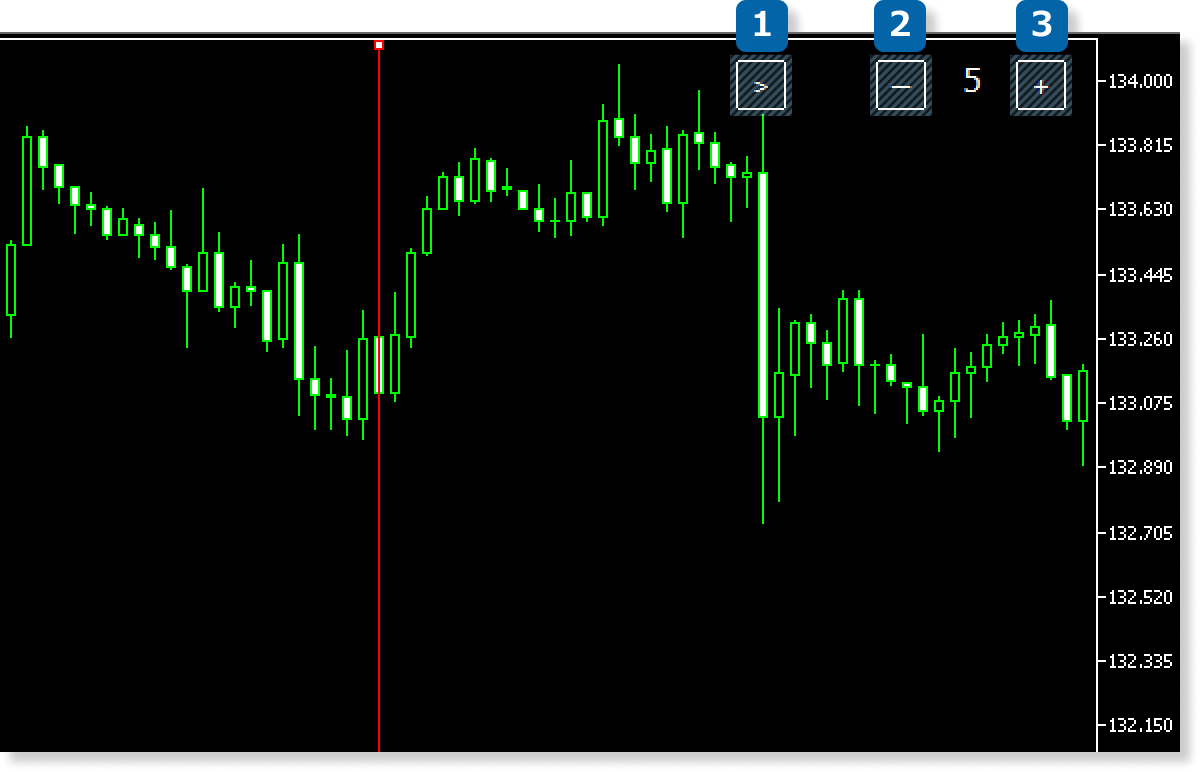
①Play/Stop
Toggles between auto-scroll play and stop.
②Decrease scroll speed
Can be slowed down to a minimum of “1”.
③Increase scroll speed
Can be sped up to a maximum of “10”.
The display during auto-scroll function playback and when stopped appears as follows.
If the timeframe is changed while the reference line is near the current bar, the line may shift out of center. Rest assured, its position and subcharts remain synchronized properly. To correct this, manually adjust the chart range to reposition the line as needed.
How to install
To use the Chart Shift Tool, follow the steps below to download and install it.
Step 1
Click the button below to download the indicator for MT4/MT5.
Step 2
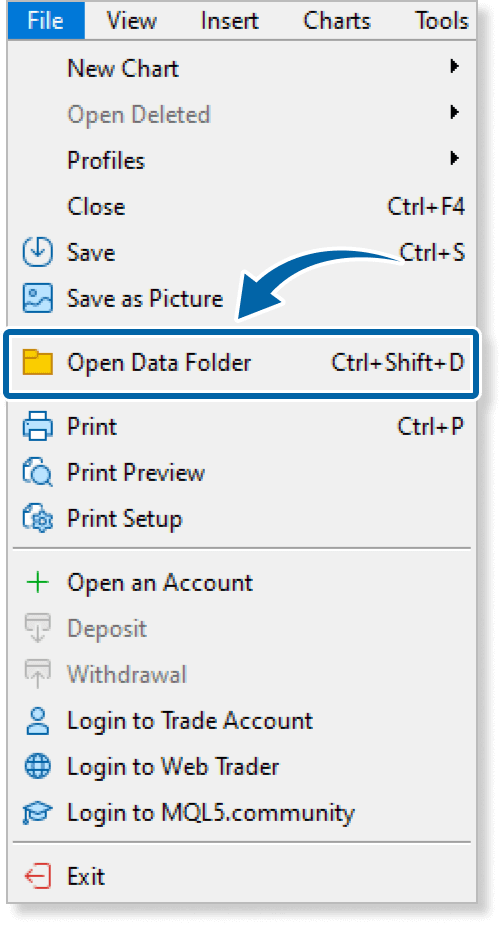
Click File > Open Data Folder in the top menu of MT4/MT5.
Step 3
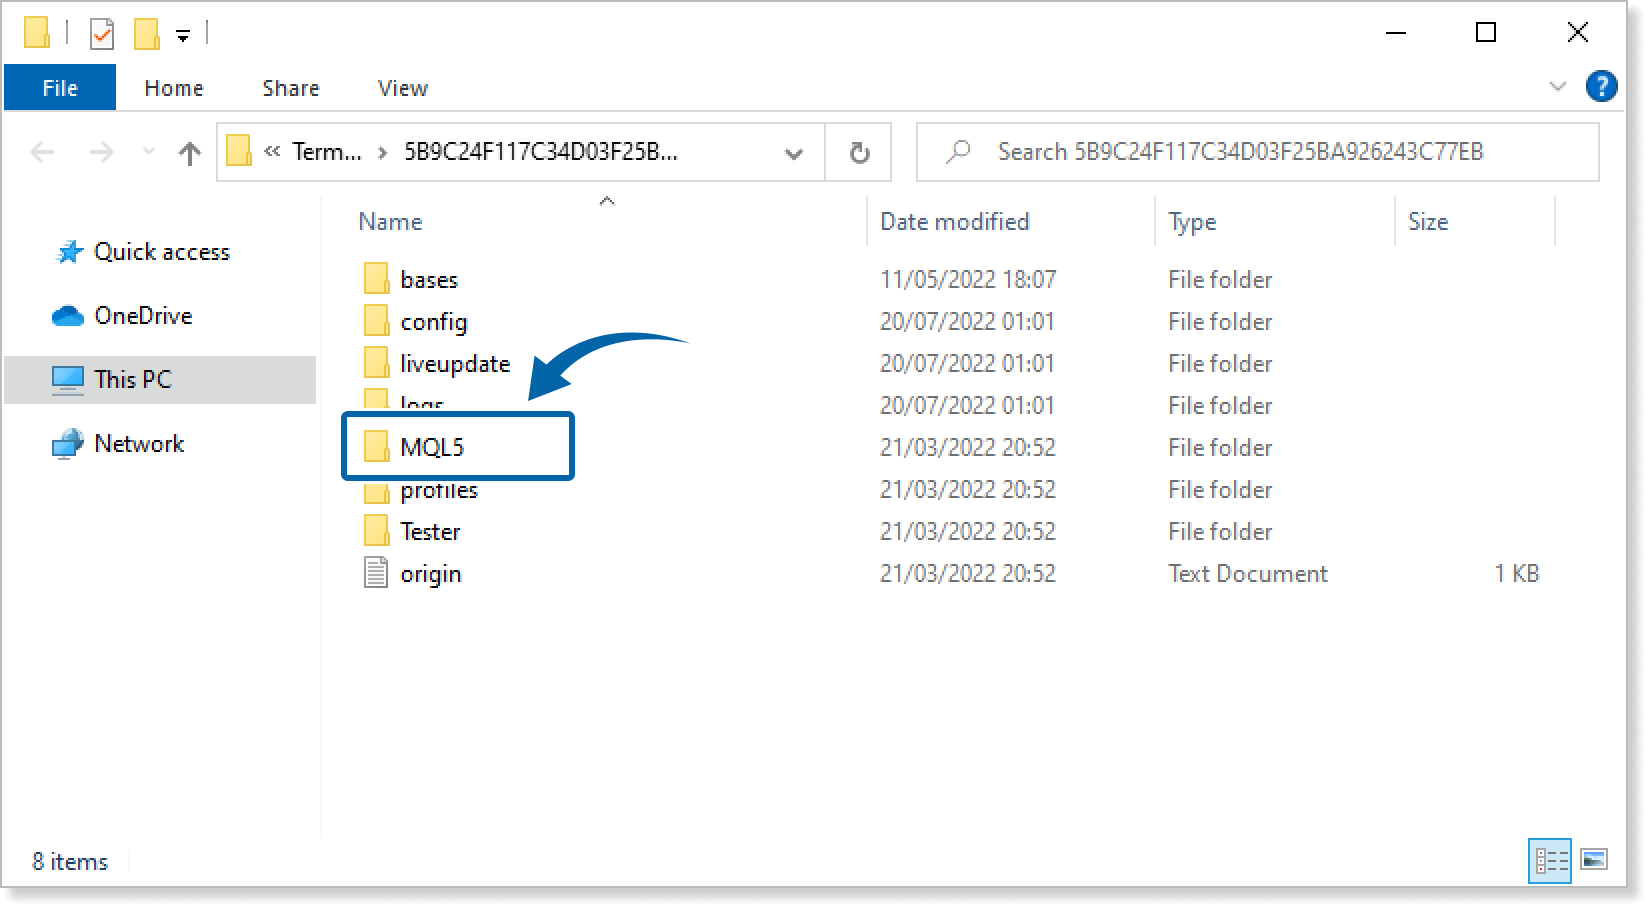
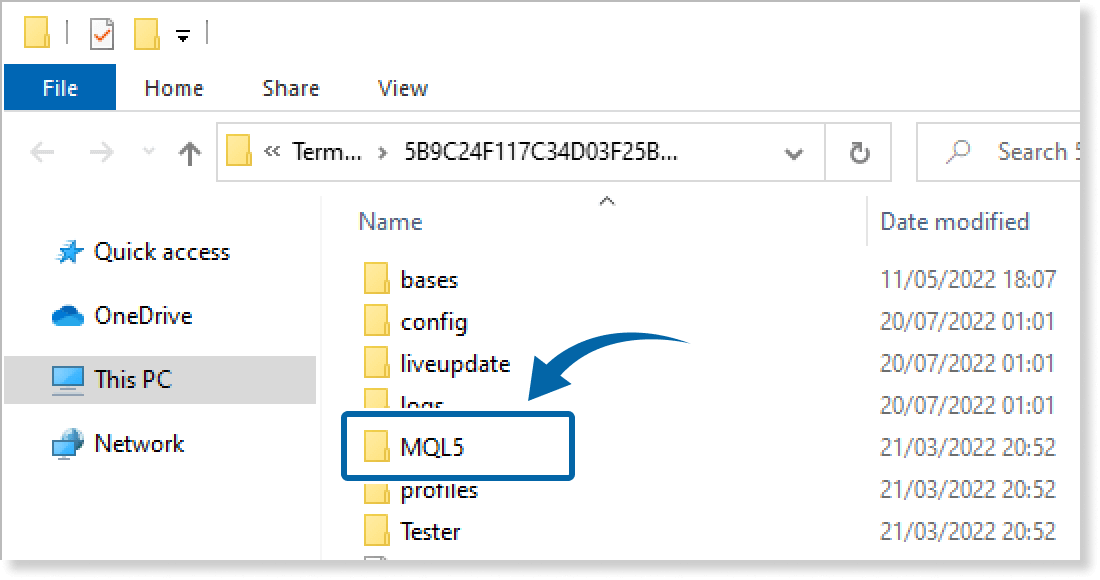
In the data folder, double-click the MQL4 or MQL5 folder.
Step 4
In the MQL4/MQL5 folder, double-click the Indicators folder.
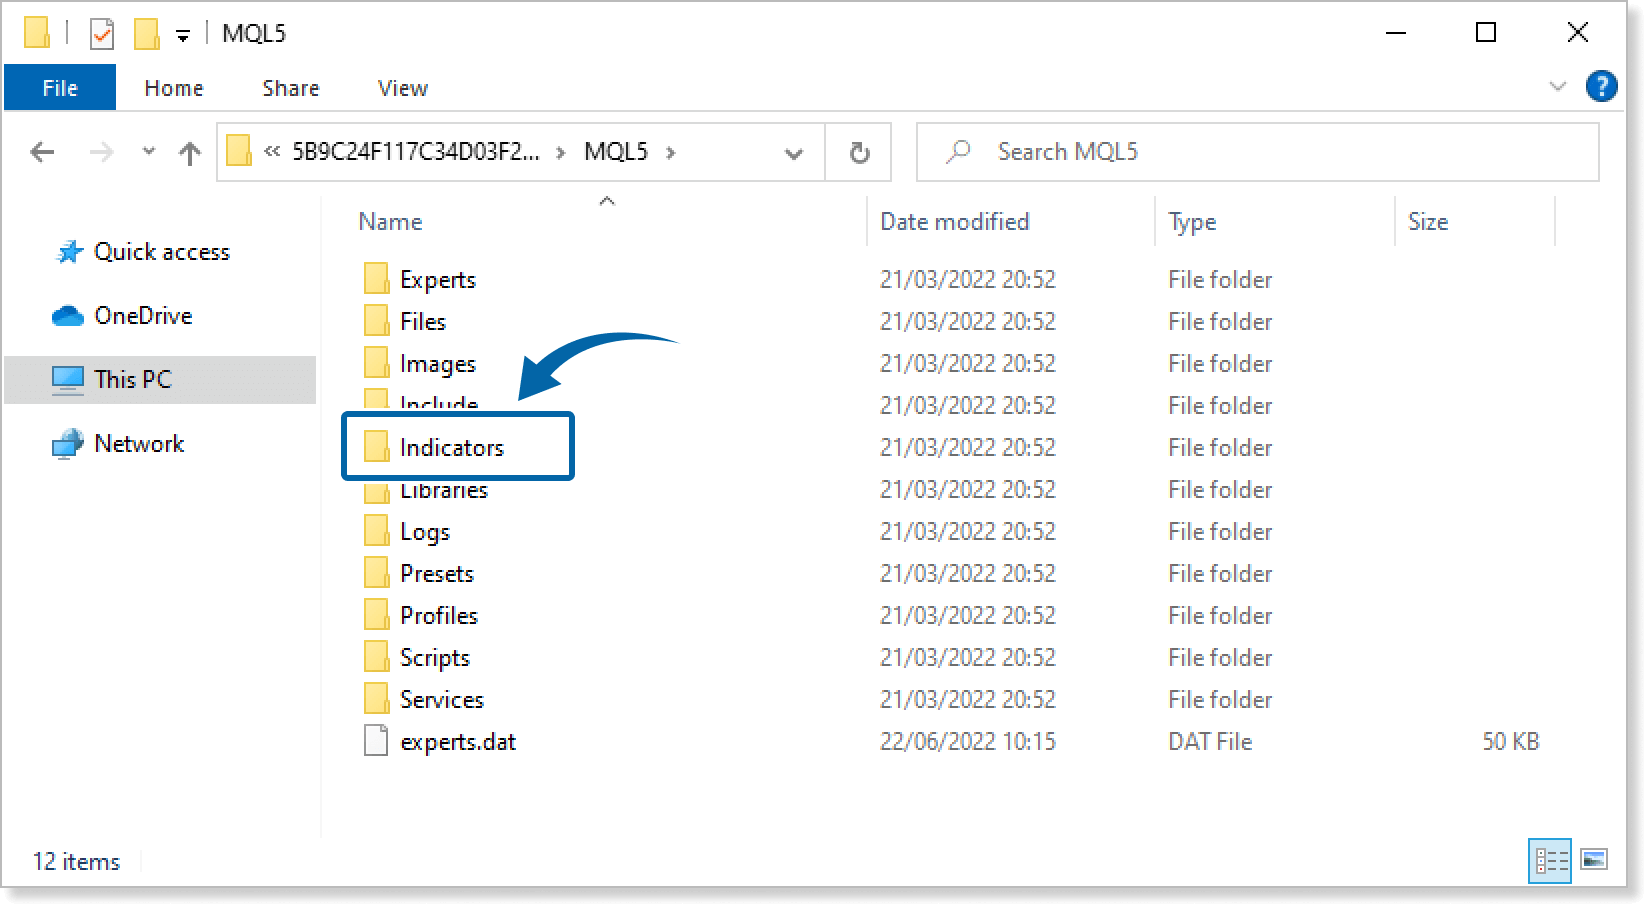
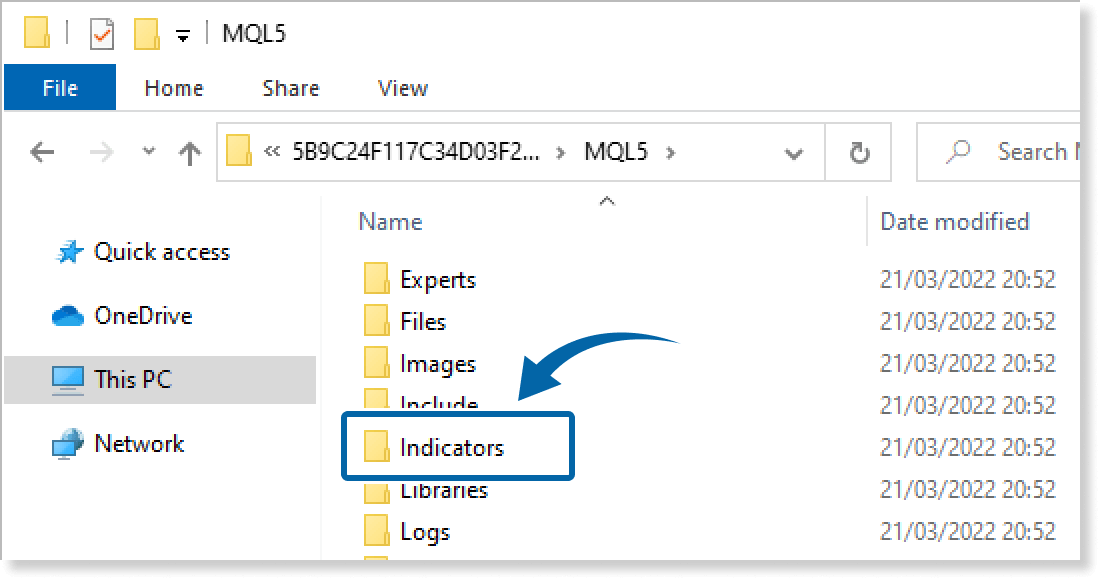
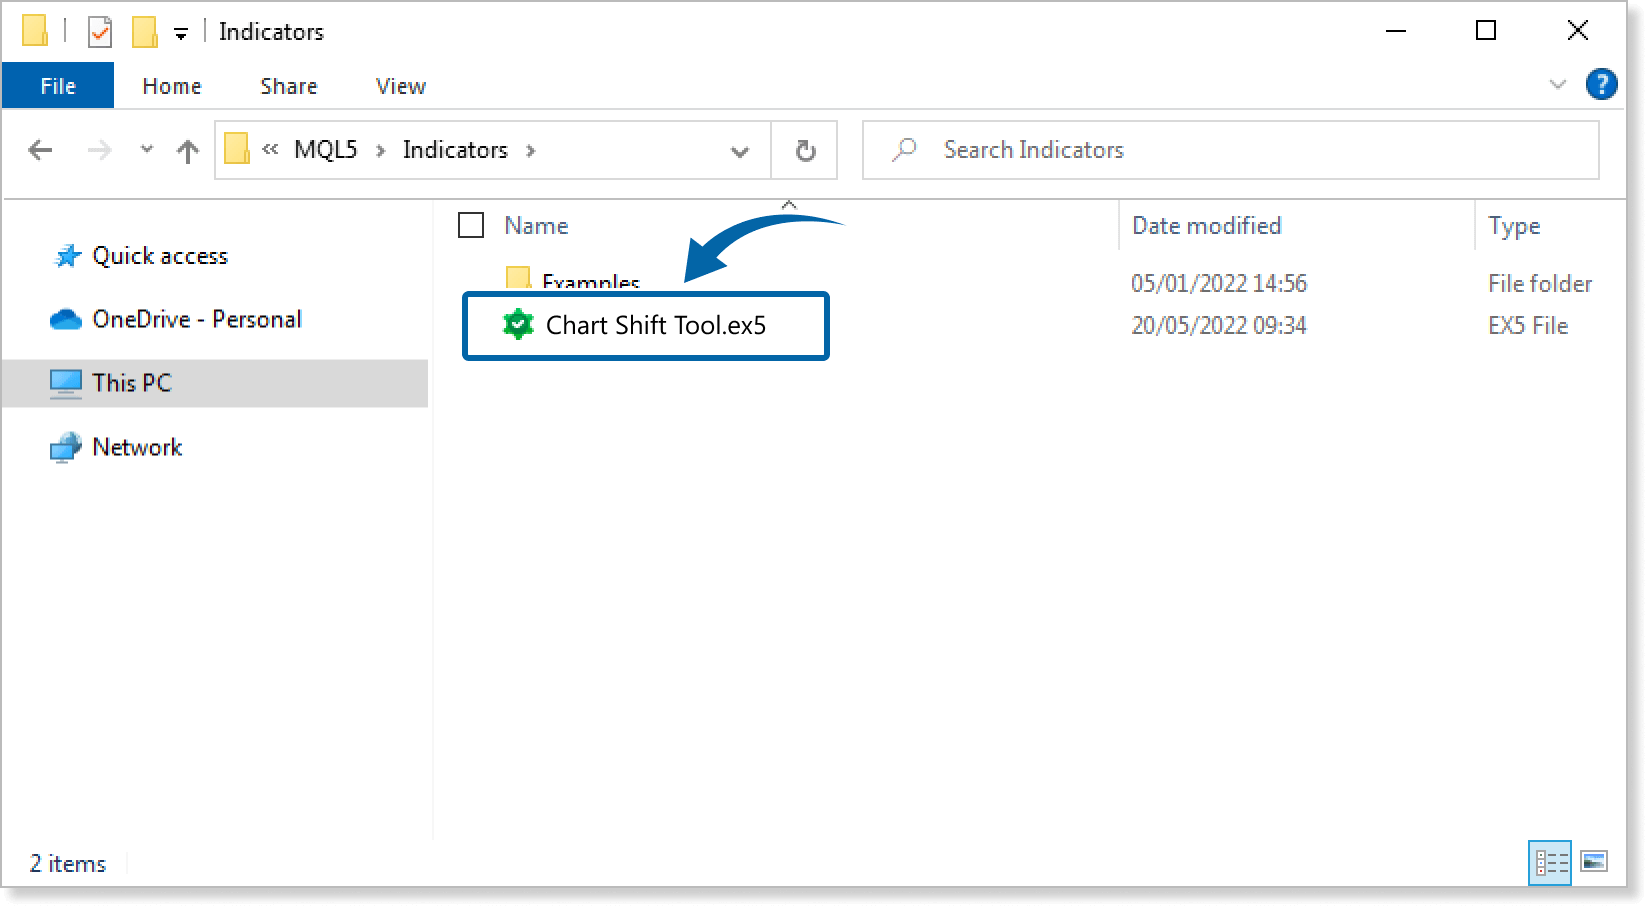
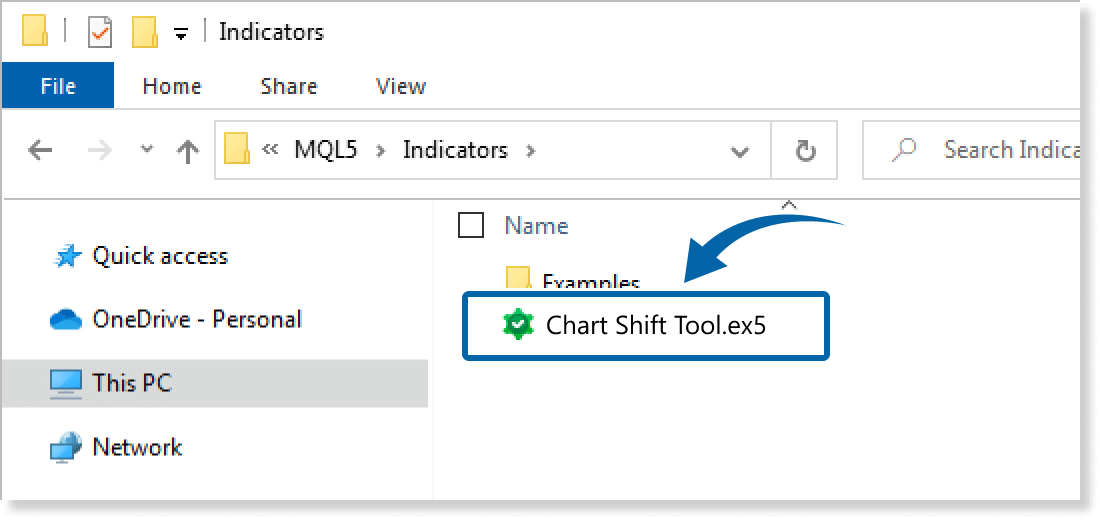
Step 5
Save the Chart Shift Tool in the Indicators folder.
Step 6
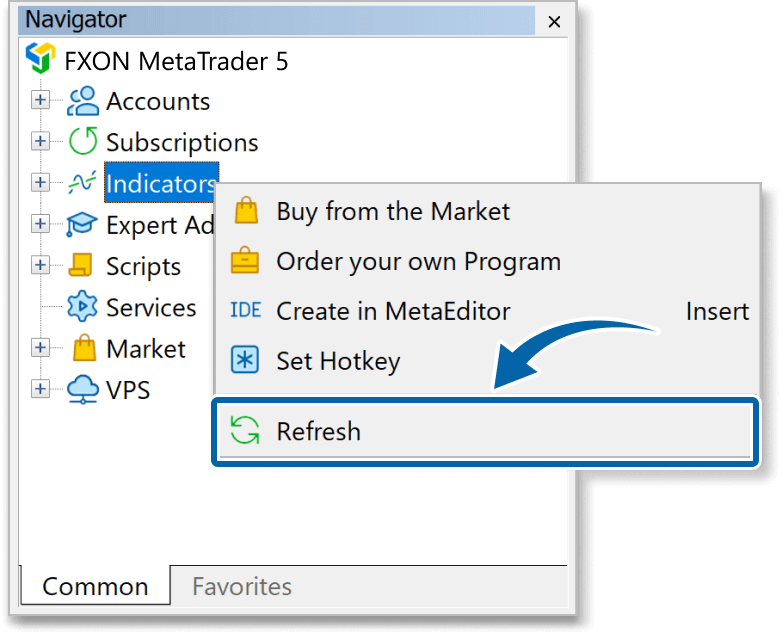
Go back to the MT4/MT5. Right-click Indicators in the Navigator, and click Refresh.
Step 7
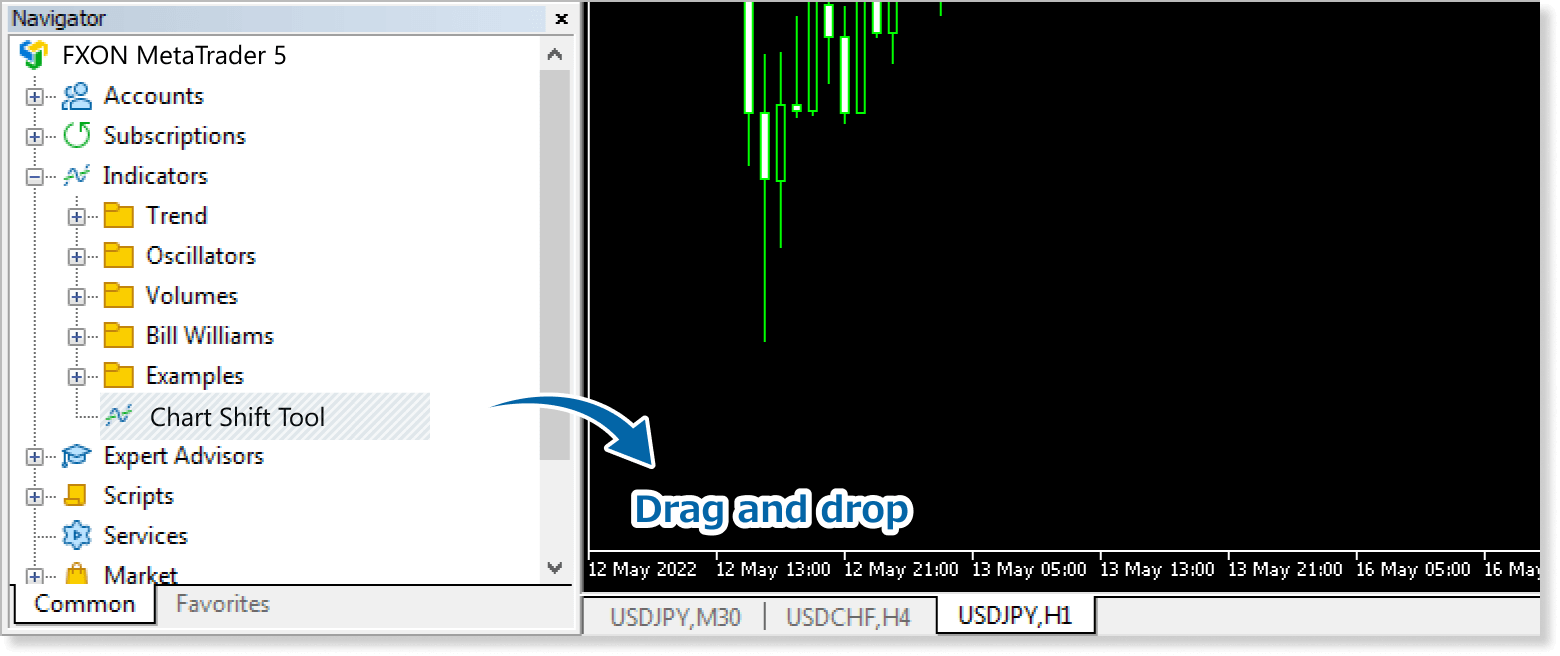
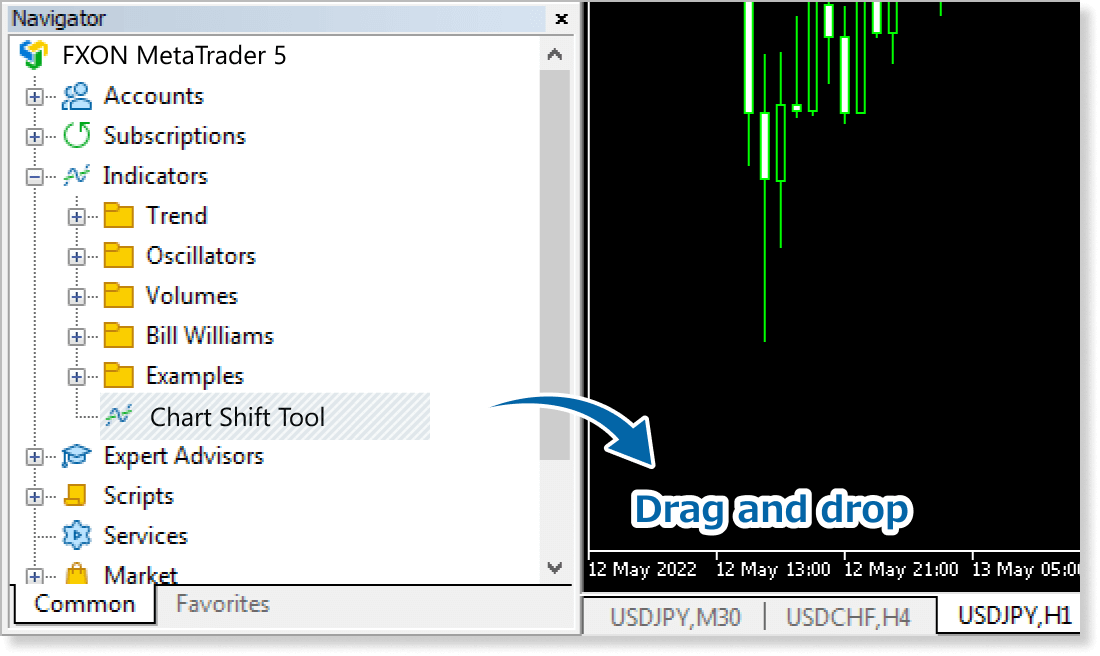
In the Navigator, click the + icon next to Indicators. Find the Chart Shift Tool, then either double-click it or drag it onto a chart.
Step 8
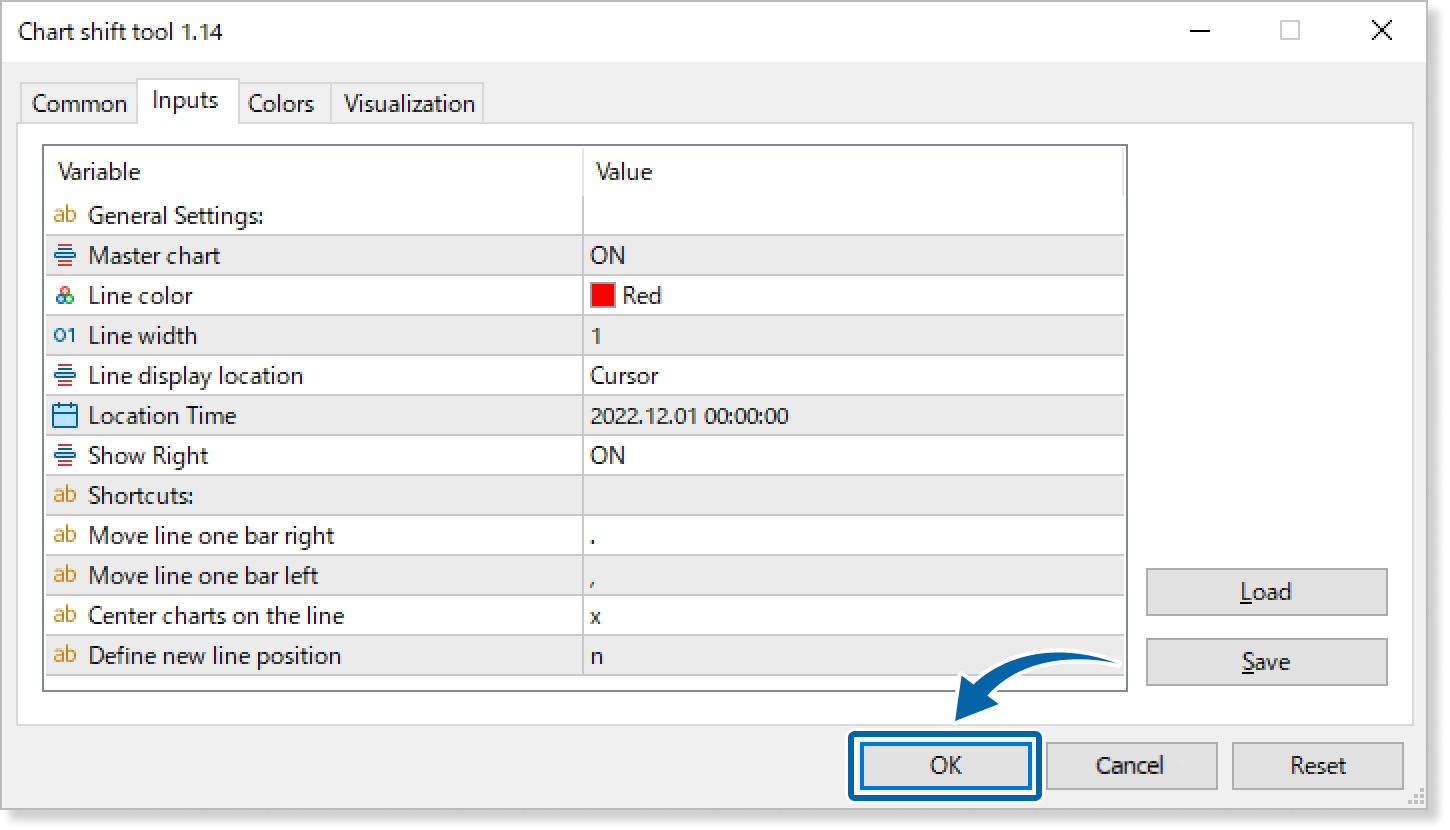
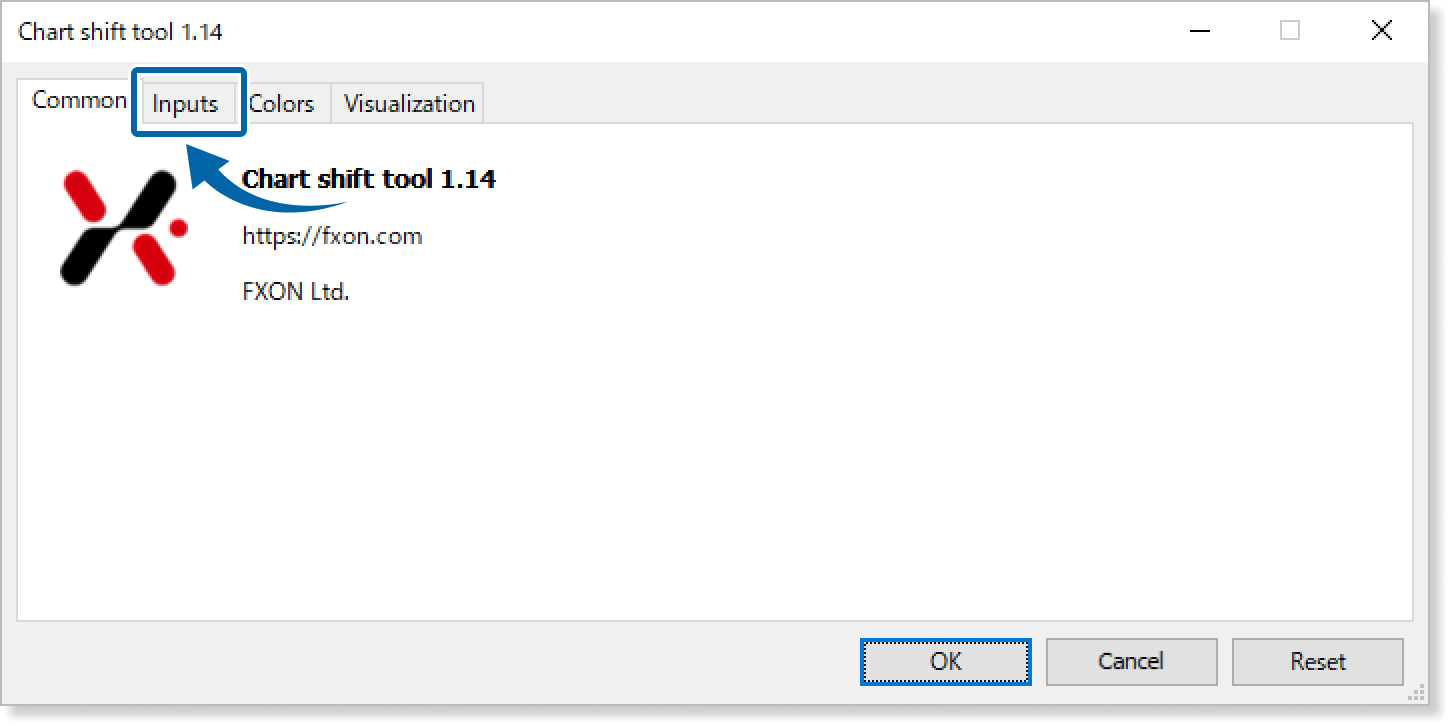
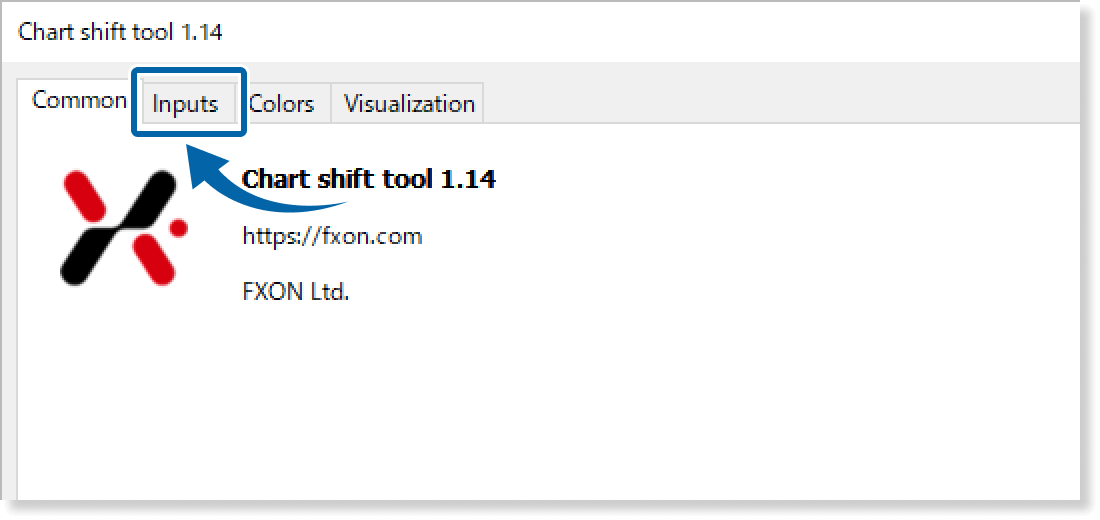
In the indicator settings window, customize the settings on the Inputs tab according to the How to set up page, then click OK.
Step 9
The Chart Shift Tool is applied to the chart and the line and buttons will be displayed.
How to set up
Apply this indicator to at least two charts, then set the parameters according to your style.
Step 1
Apply the indicator to the desired master chart.
It is a chart where you can move the reference line and perform shortcut key operations. The master chart function “ON”/”OFF” setting is specified in the indicator settings. The reference line cannot be moved from non-master charts, and it automatically synchronizes with movements on the master chart.
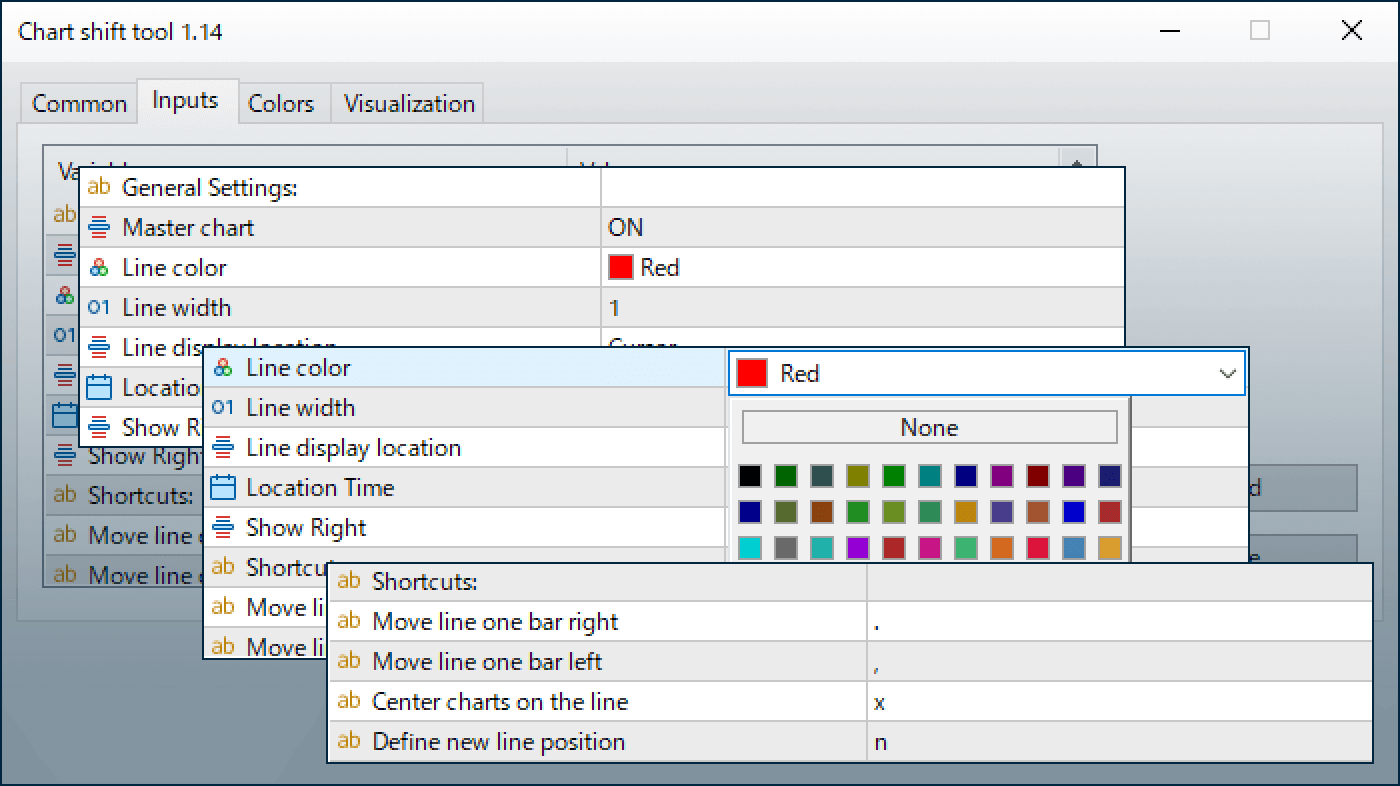
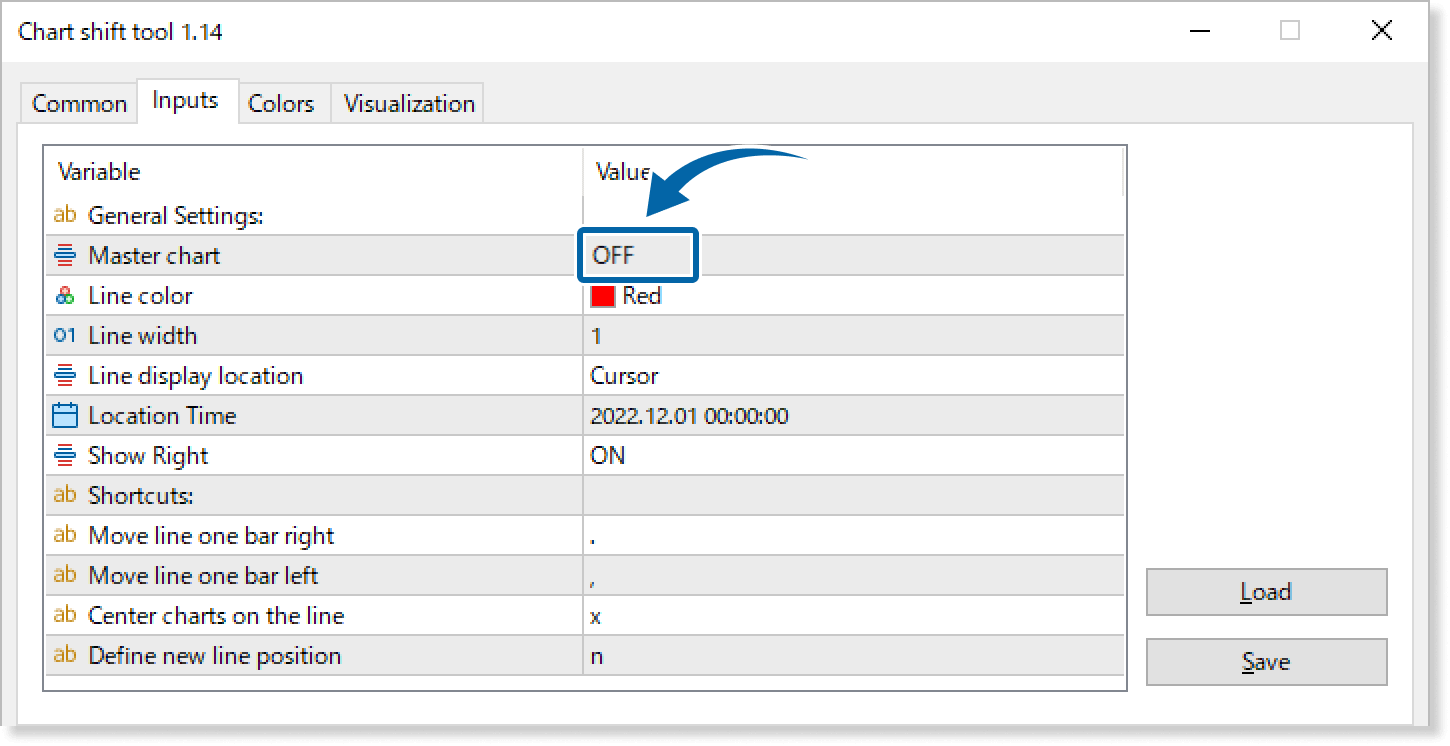
First, open the Inputs tab.
Step 2
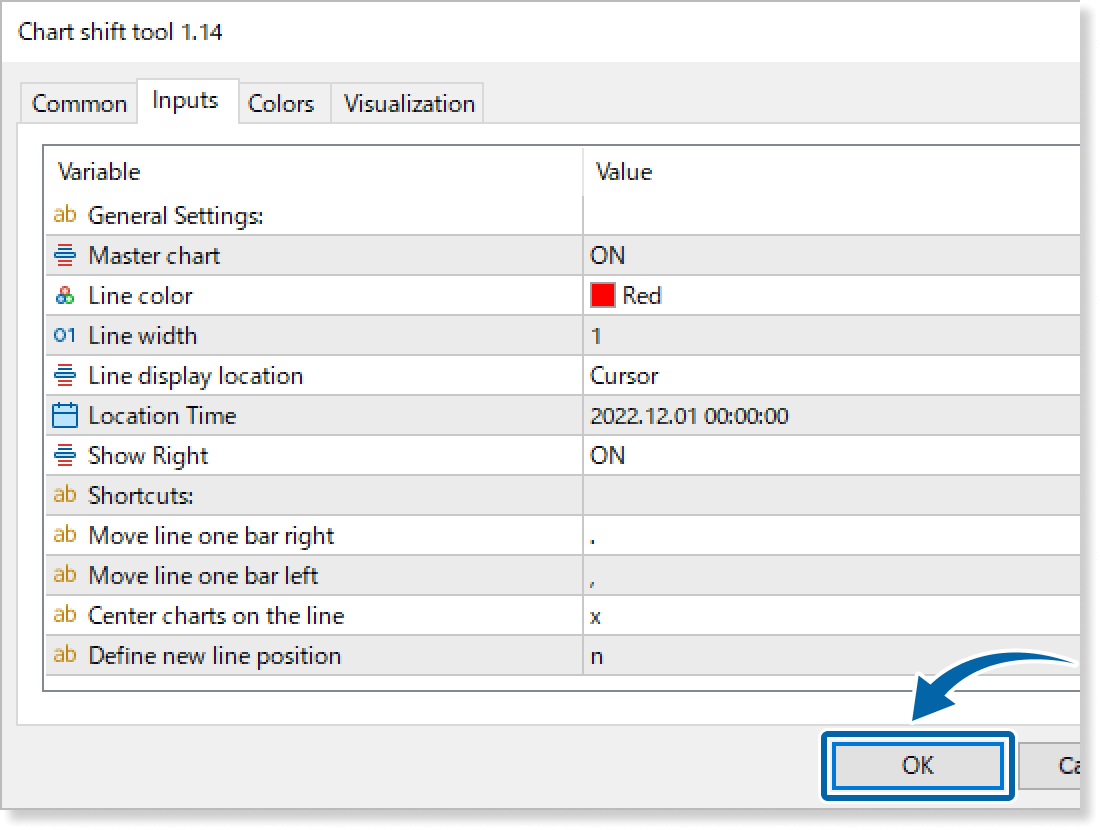
Set the parameters as follows. Ensure the ‘Master Chart’ parameter is enabled for the chart you want to usd as the master chart.
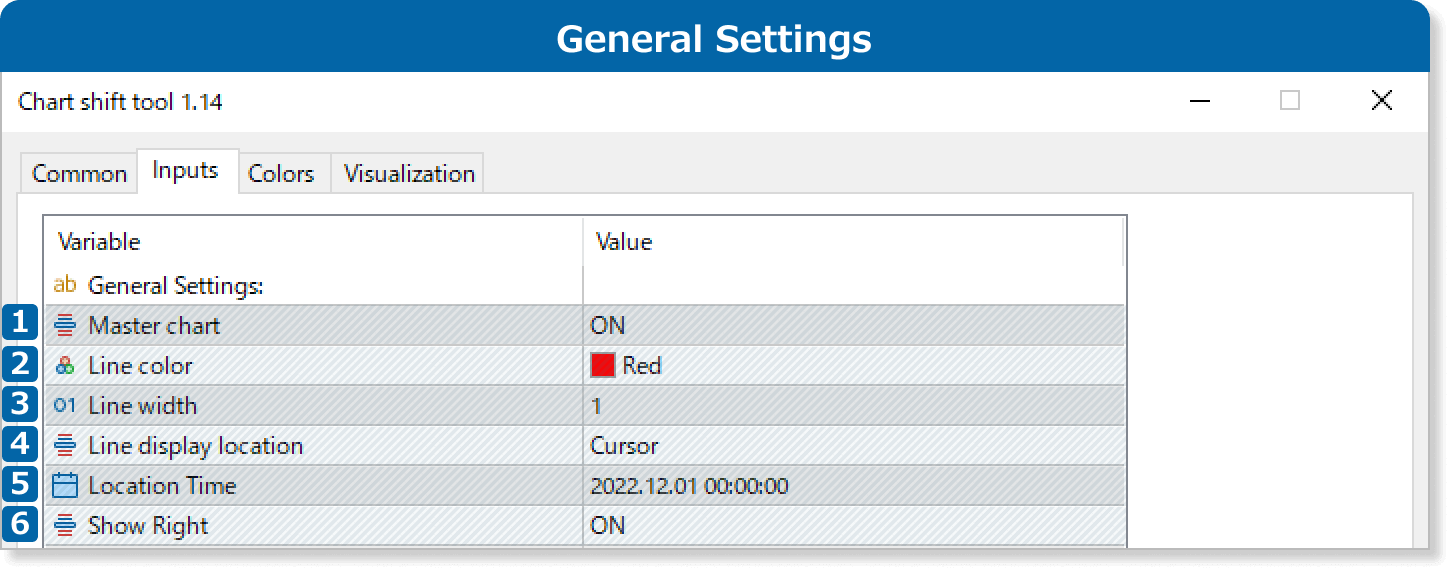
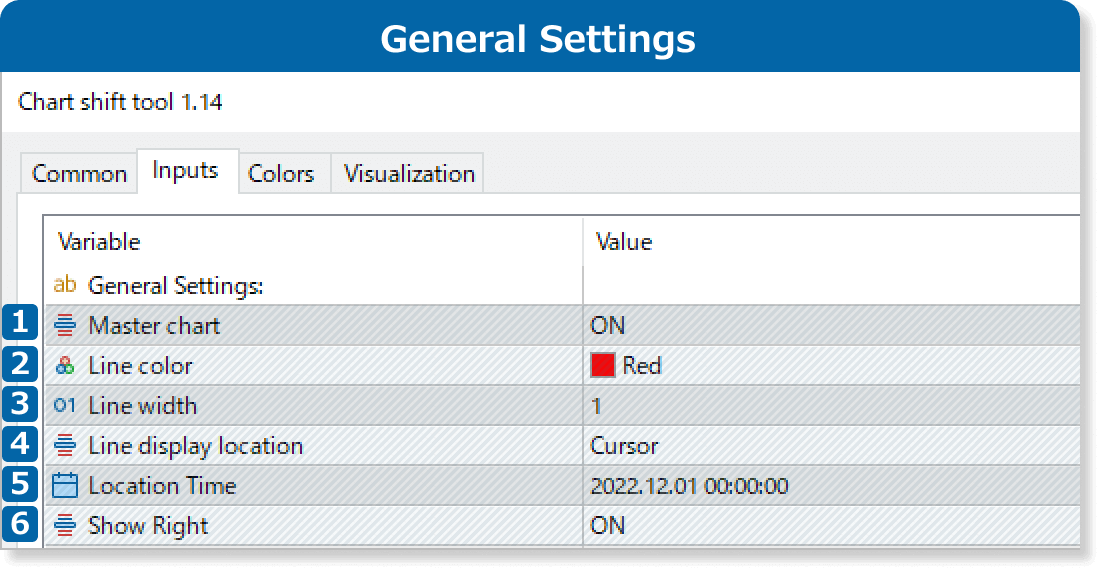
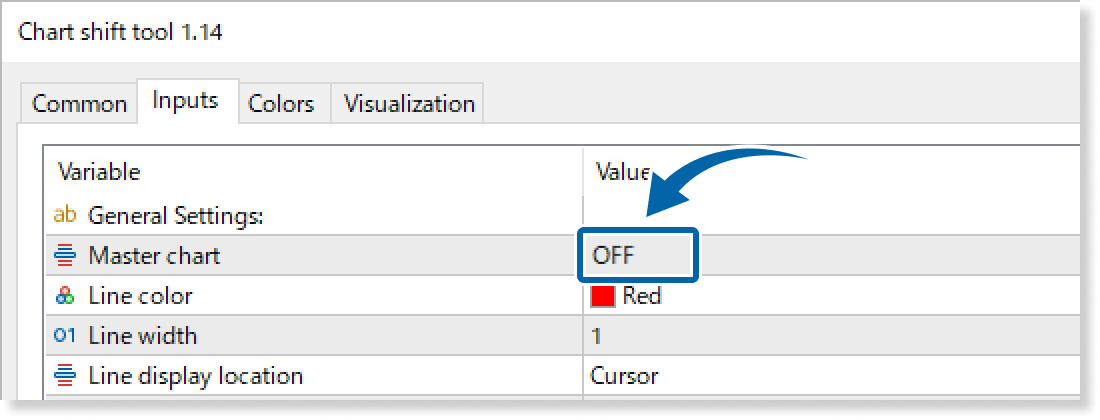
①Master chart
Set to ON to designate the chart as the master chart; otherwise, set it to OFF.
②Line color
Specify the line color.
③Line width
Specify the line width.
④Line display location
Select the reference line position from Date, Cursor (or Center on MT4), or Latest:
Date: The time specified in the 'Location Time' parameter.
Cursor: The bar where the indicator was dropped when applied on the chart. *1
Center: The center of the chart when the indicator was applied.
Latest: The most recent bar.
⑤Location Time
Specify the reference line time to minutes only if 'Line display location' is set to 'Date'.
⑥Show Right
Show or hide the chart to the right of the reference line with ON/OFF.
*1 If the indicator is applied via double-clicking or the Navigator's context menu, the reference line will be set on the most recent bar.
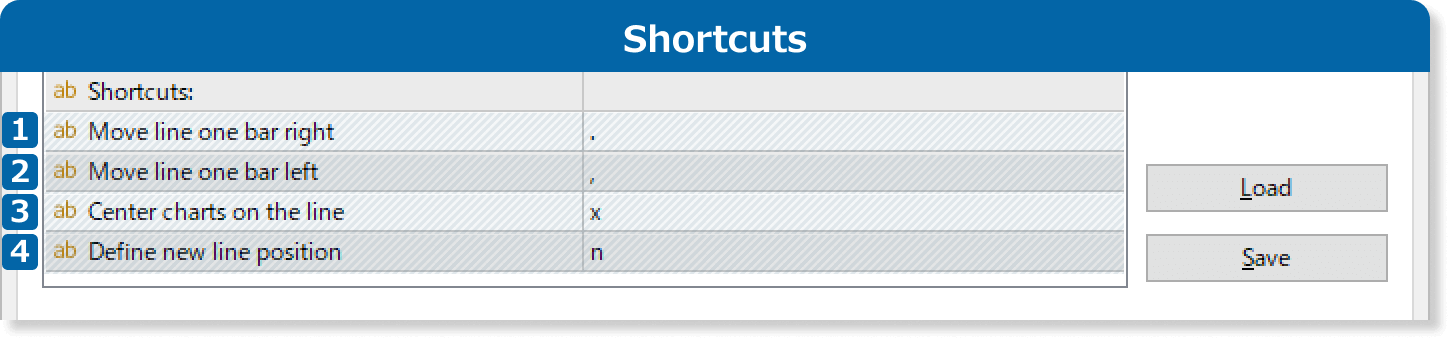
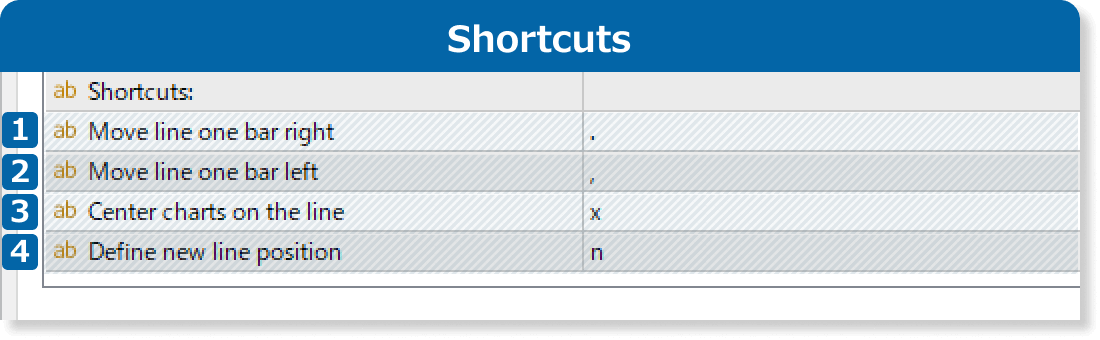
①Move line one bar right
Assign a key to move the line one bar to the right. The default key is ‘.’, and shortcut keys are only available on the master chart.
②Move line one bar left
Assign a key to move the line one bar to the left. The default key is ‘,’, and shortcut keys are only available on the master chart.
③Center charts on the line
Assign a key to center the line on the chart. The default key is ‘x’, and shortcut keys are only available on the master chart.
④Define new line position
Assign a key to move the line to a specific bar. To do so, press this key and click on the bar where you want the line to be positioned.The default key is ‘n’, and shortcut keys are only available on the master chart.
When the Auto Scroll option is enabled on MT5, the chart will automatically update to the latest bar, overriding settings like "Center charts on the line." To prevent this, ensure the Auto Scroll option is turned off.
Step 3
Apply the indicator to other charts where you want the reference line displayed. Be sure to turn off the 'Master chart' parameter on those charts.
When applying the Chart Shift Tool to multiple charts, if settings would result in two or more master charts, an alert will be displayed and the indicator will not be applied. Set the “Master Chart” item to “ON” only for the chart where you want to perform reference line operations, and set the “Master Chart” item to “OFF” for other charts.
Updates