


#technical
#mainchart
#technical
#mainchart
Downloaded:
0
times
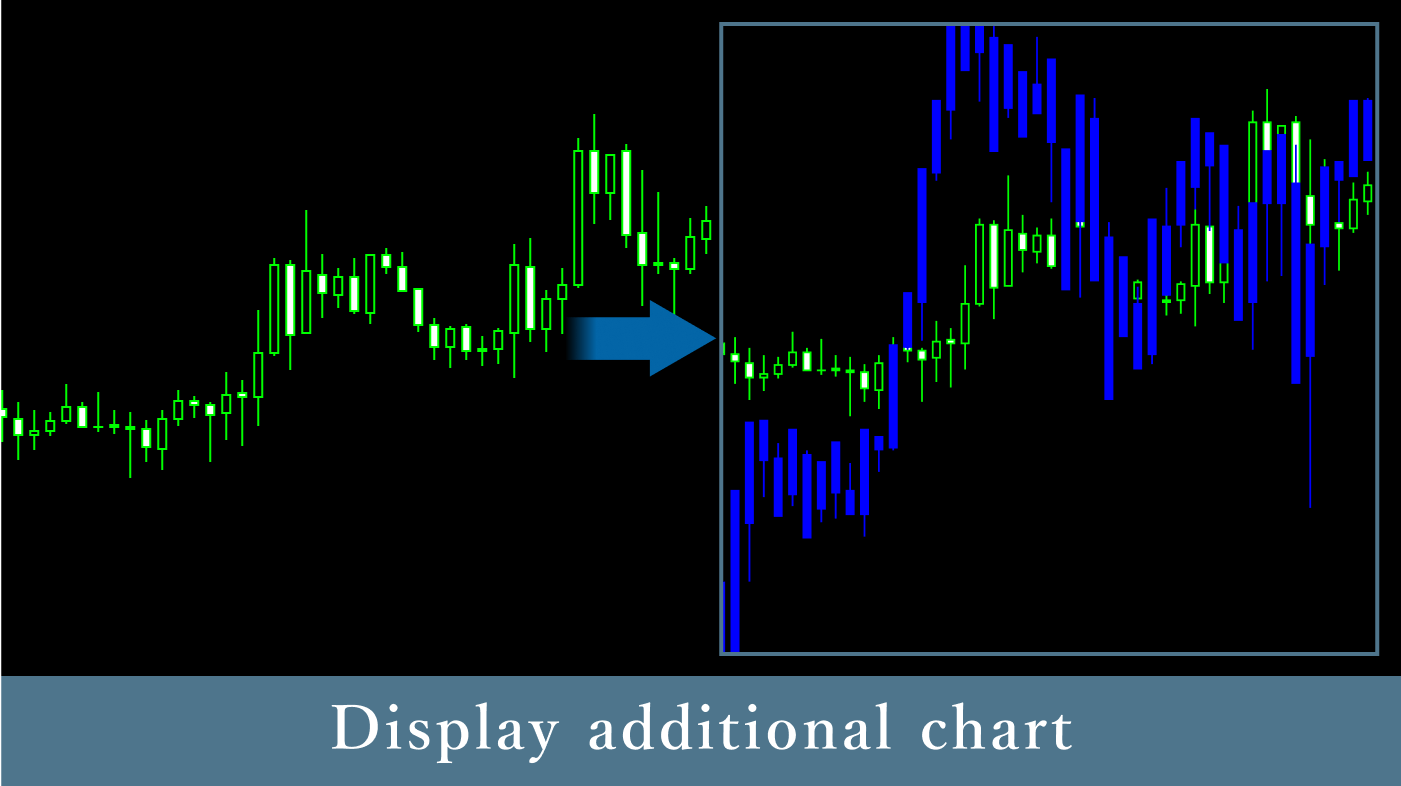
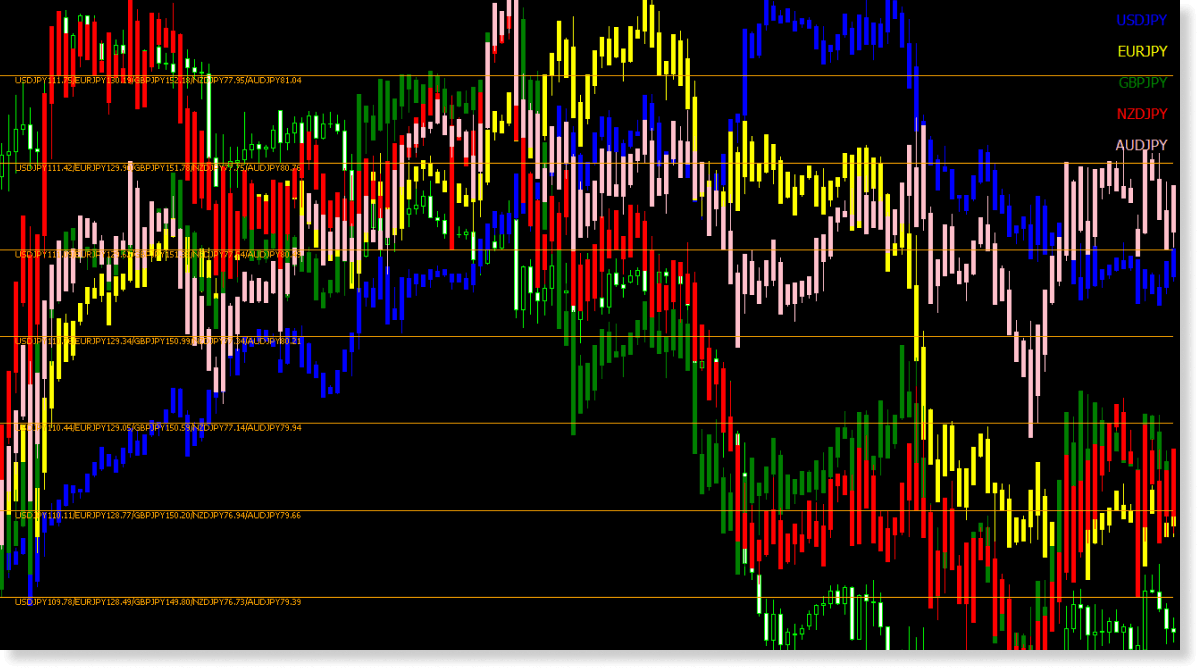
The Chart Overlay Indicator allows you to display up to 5 instruments on a single chart. It can be used for purposes such as simultaneously displaying correlated pairs like EURUSD and GBPUSD, or displaying stock indices like the Dow Jones Industrial Average on FX currency pair charts.
Downloaded:
0
times
Usage scenarios
Displaying other currency pairs on charts for analysis
Using the Chart Overlay Indicator, you can analyze while displaying other currency pairs within a single chart. For example, when analyzing EURUSD, you can additionally display the price movement of GBPUSD, which tends to move in correlation, on the EURUSD chart.
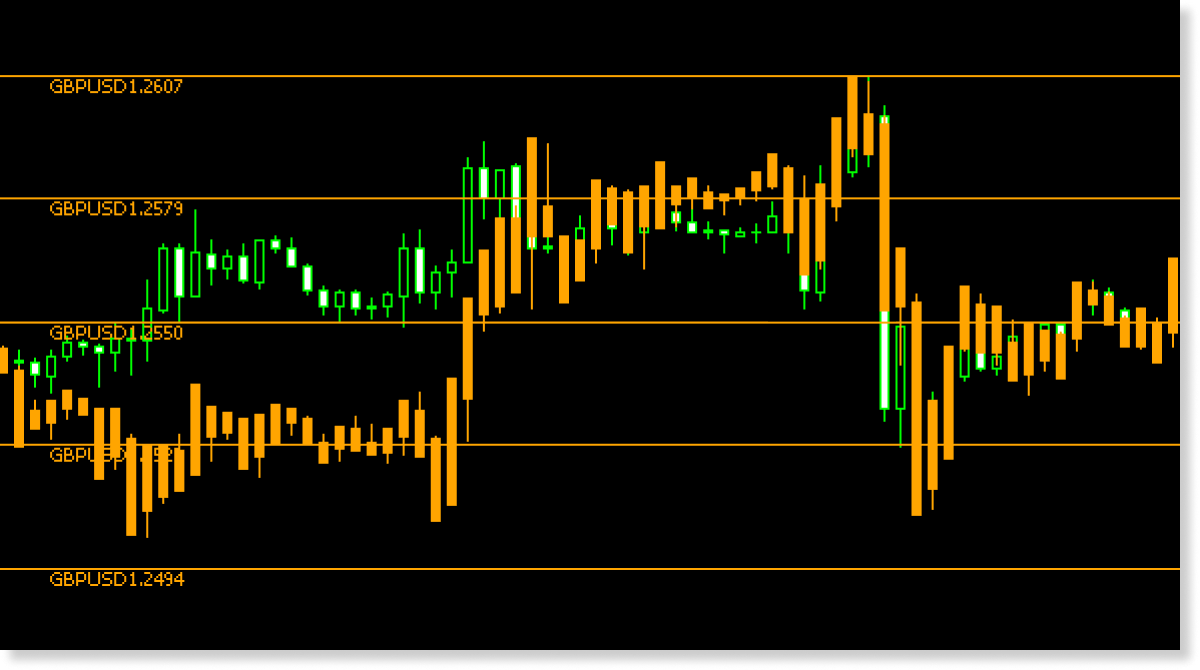
Since each currency pair has different rates, you can display their rates at customizable intervals. Rate display can be adjusted from hidden to showing fewer rates.
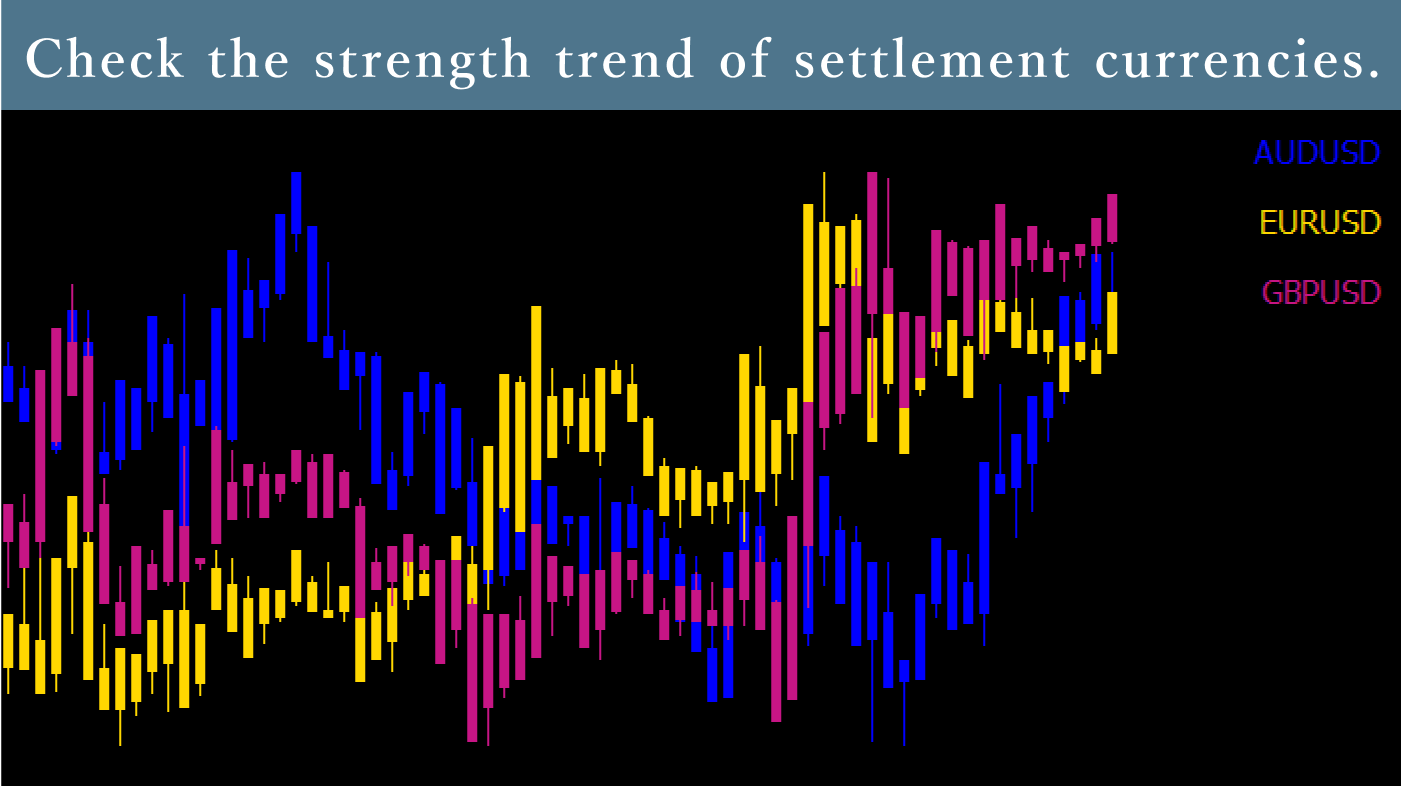
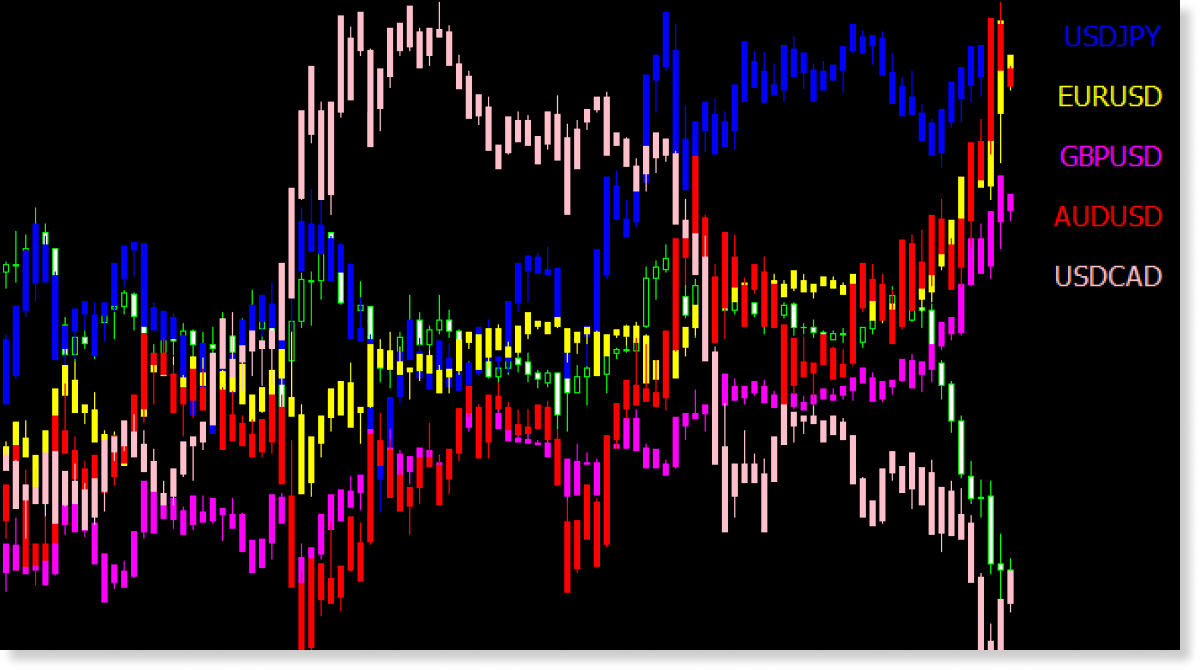
Display up to 5 symbols for multi-angle analysis
Up to 5 price movements can be displayed in a single chart, allowing you to analyze USD-based market trends by displaying major dollar straight currency pairs like USDJPY, EURUSD, GBPUSD, AUDUSD, and USDCAD.
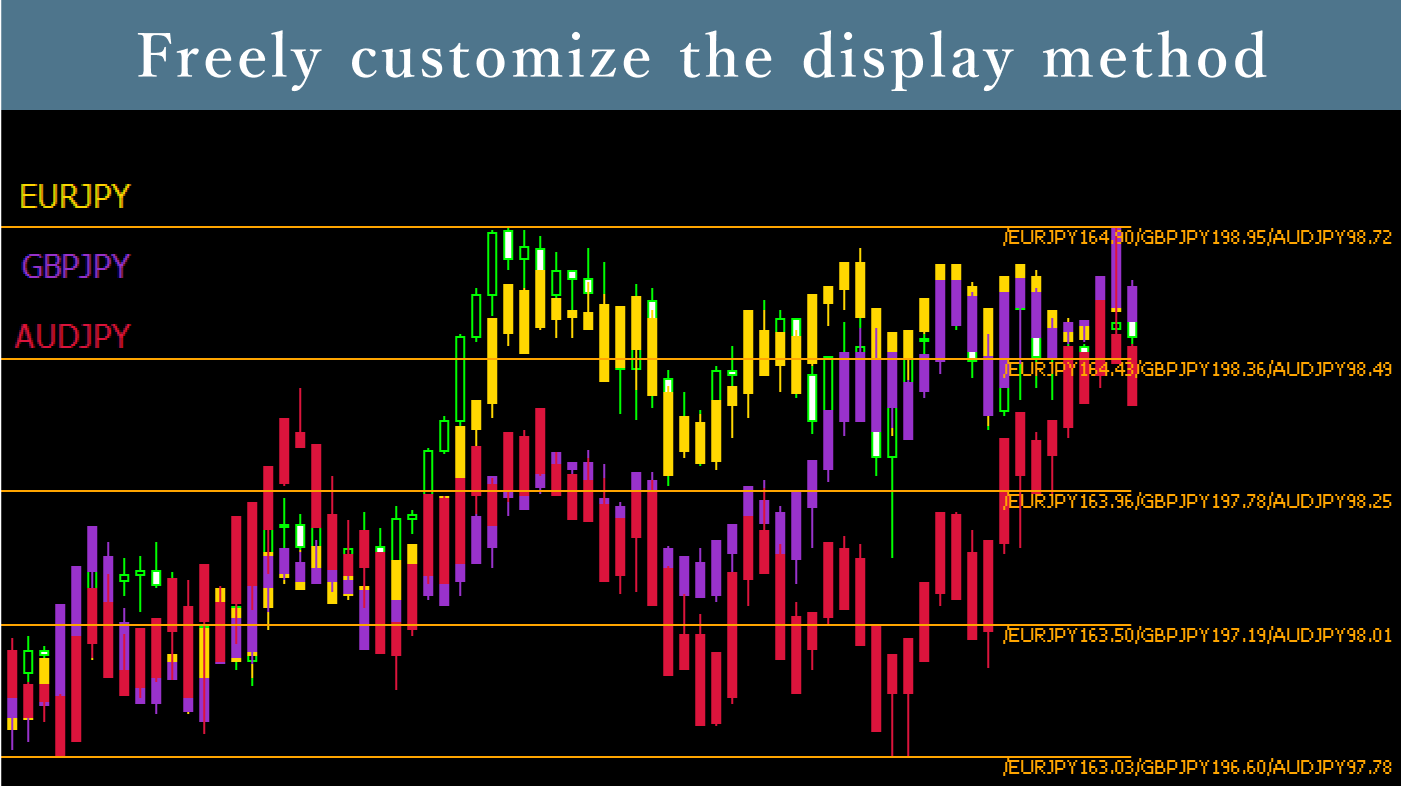
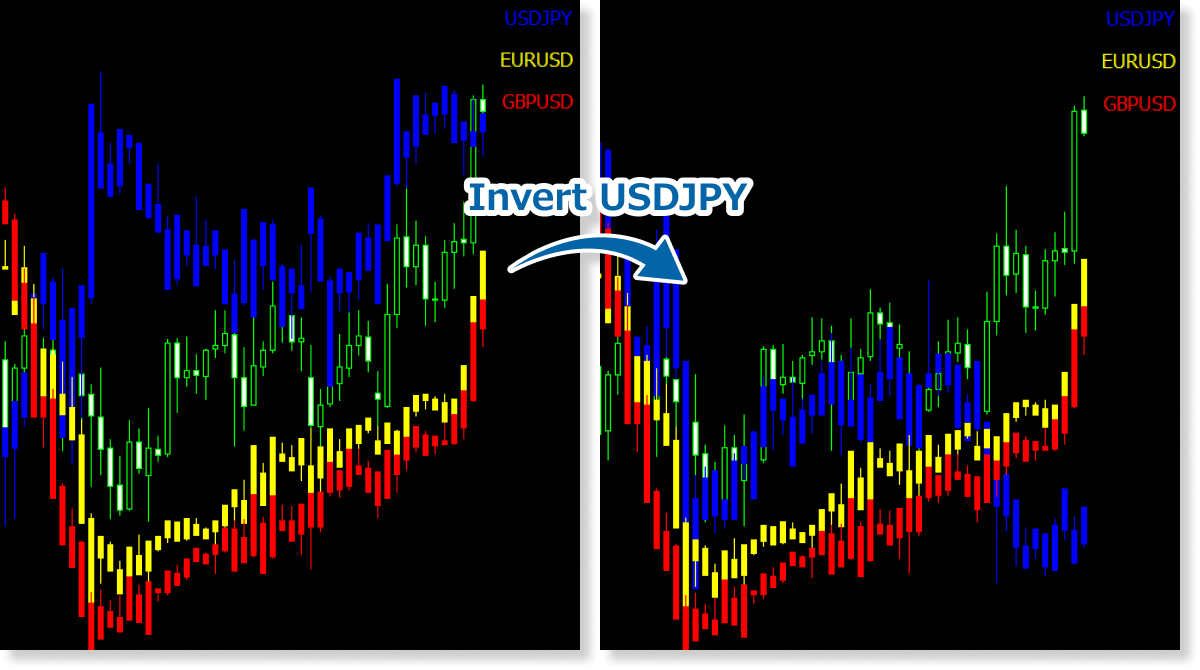
Reverse price movements for new perspectives
You can analyze currency pairs from different perspectives by reversing the display, such as converting USDJPY to JPYUSD. For example, when comparing EURUSD and GBPUSD with USDJPY, converting USDJPY to JPYUSD allows comparison with all pairs having USD as the settlement currency.
You can apply the indicator settings above by downloading the settings file from the button below and importing it.
DownloadAdditional charts overlaid by this indicator are always displayed as candlestick charts, regardless of the original chart type. In MT5, you can choose from bar, line, or candlestick charts, but when this indicator is applied, any additional charts will appear in candlestick format.
How to install
To use the Chart Overlay Indicator, follow the steps below to download and install it.
Step 1
Click the button below to download the indicator for MT4/MT5.
Step 2
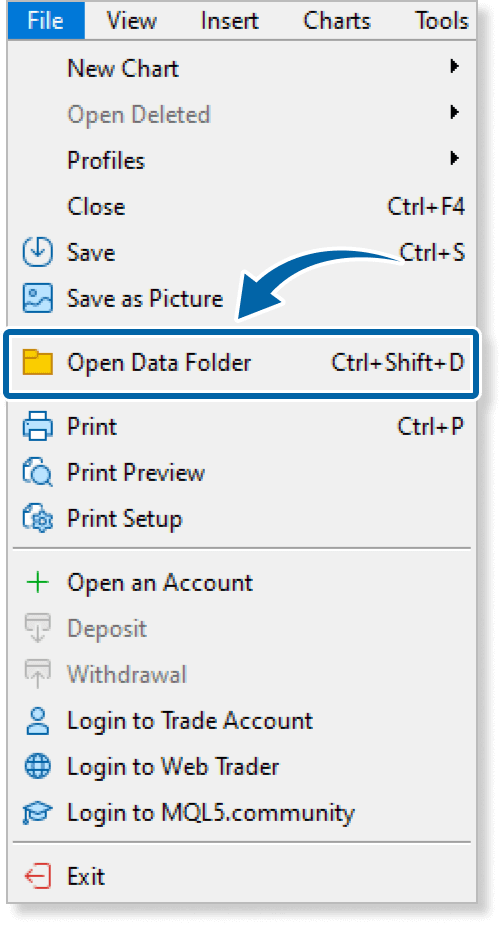
Click File > Open Data Folder in the top menu of MT4/MT5.
Step 3
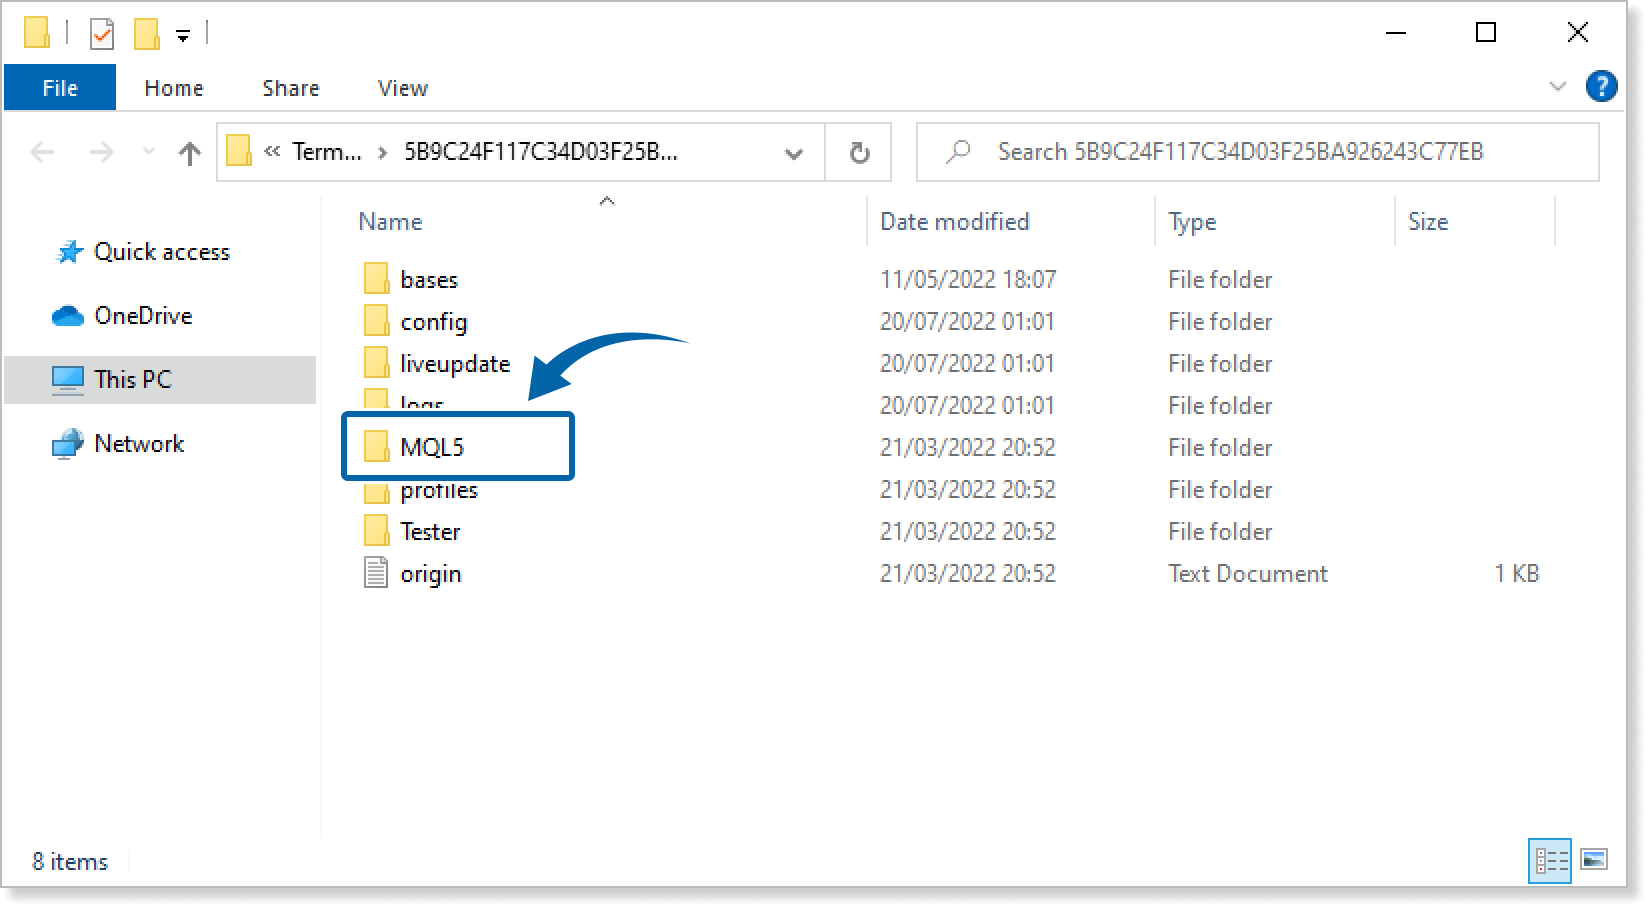
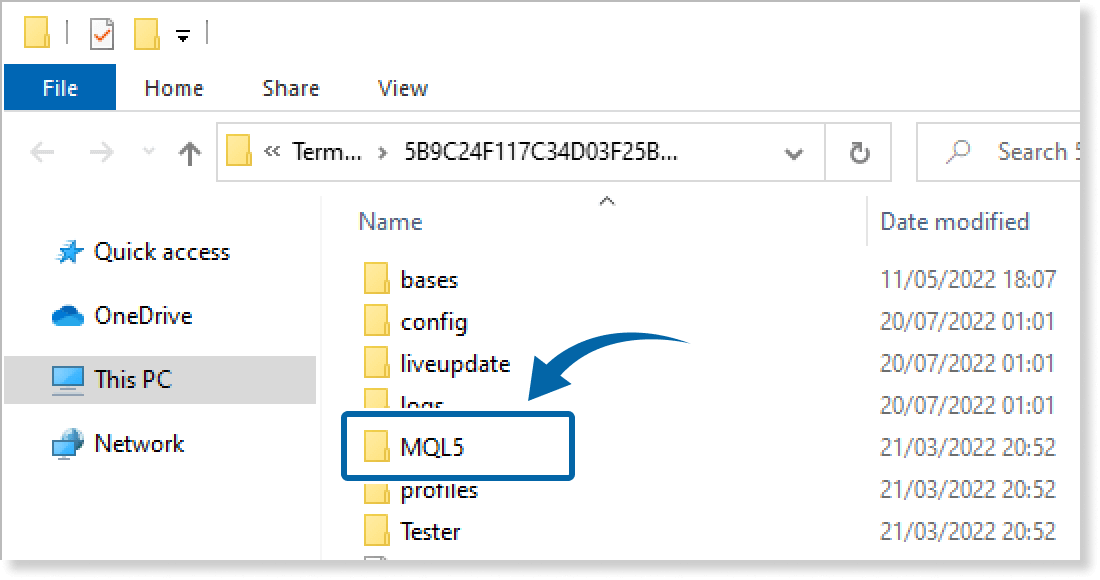
In the data folder, double-click the MQL4 or MQL5 folder.
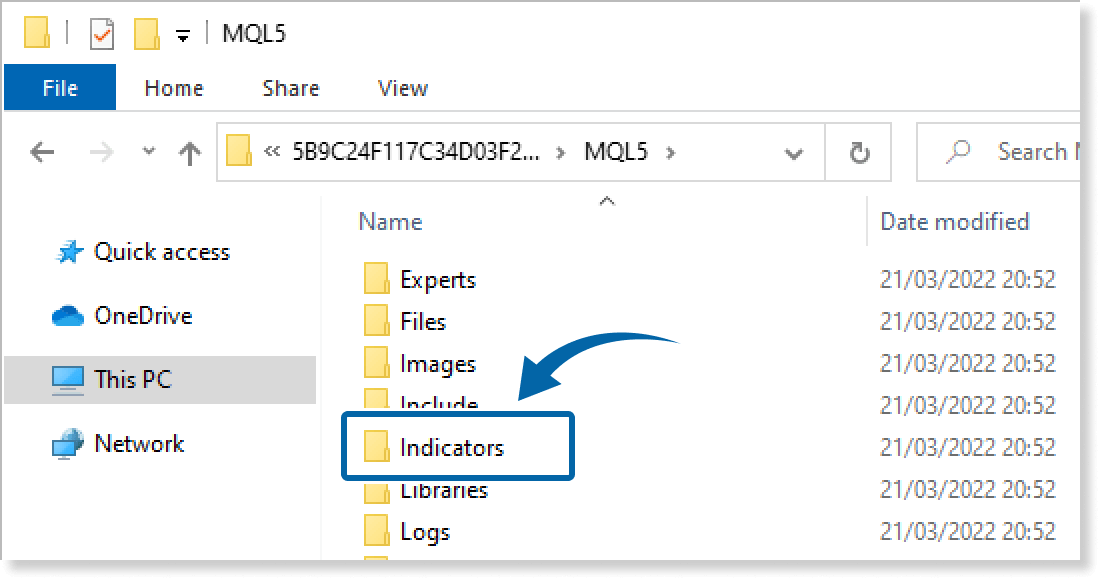
Step 4
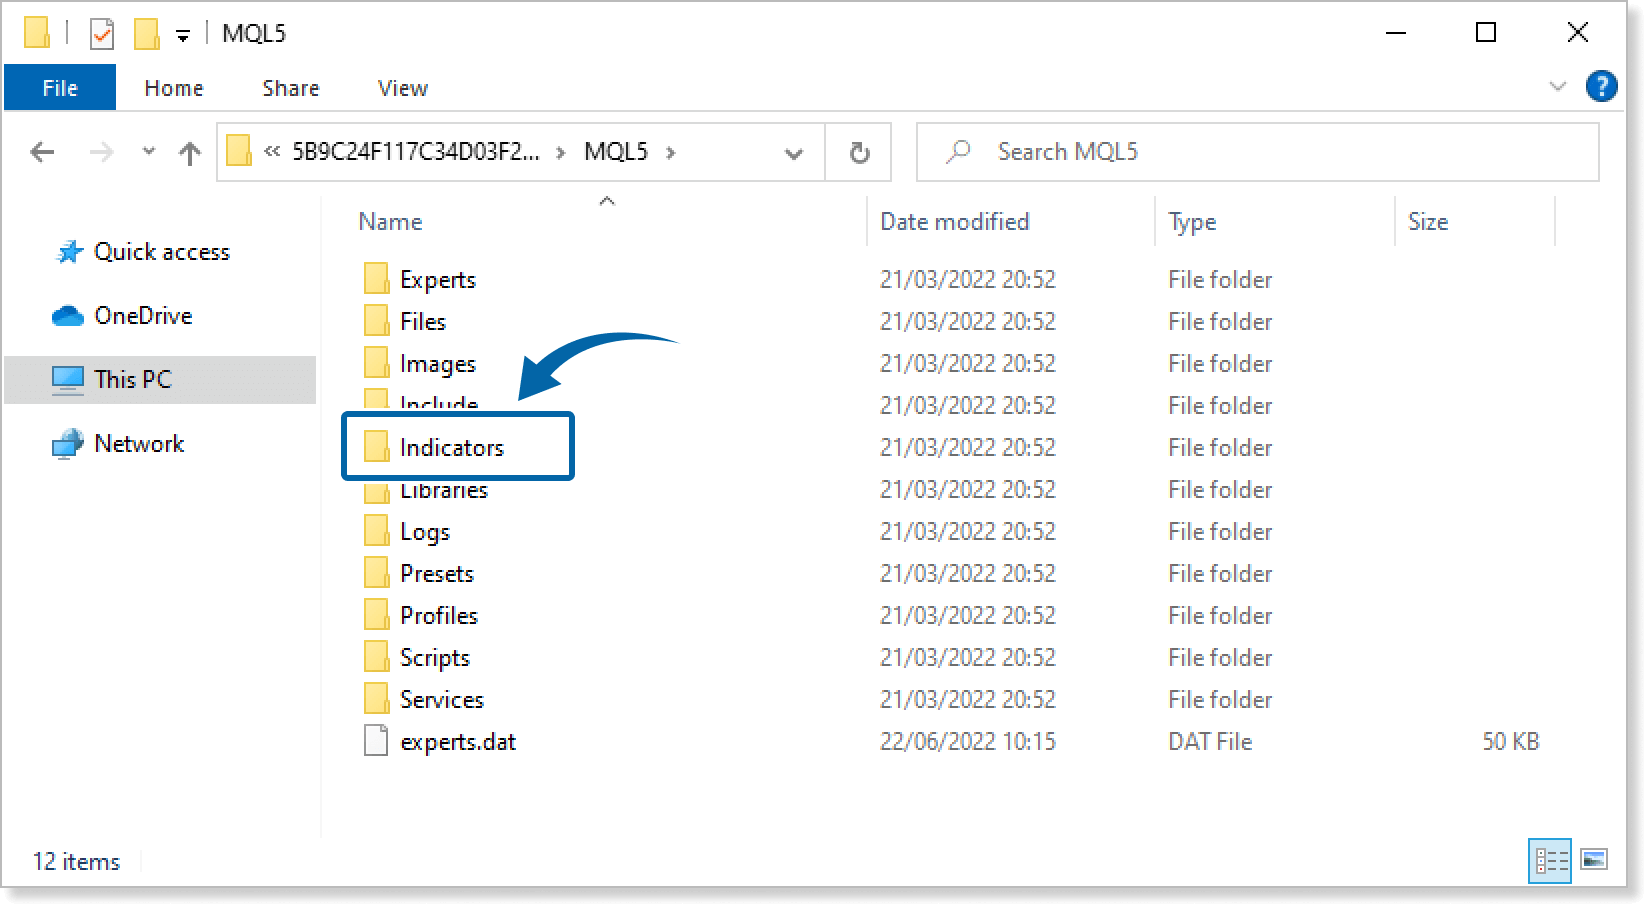
In the MQL4/MQL5 folder, double-click the Indicators folder.
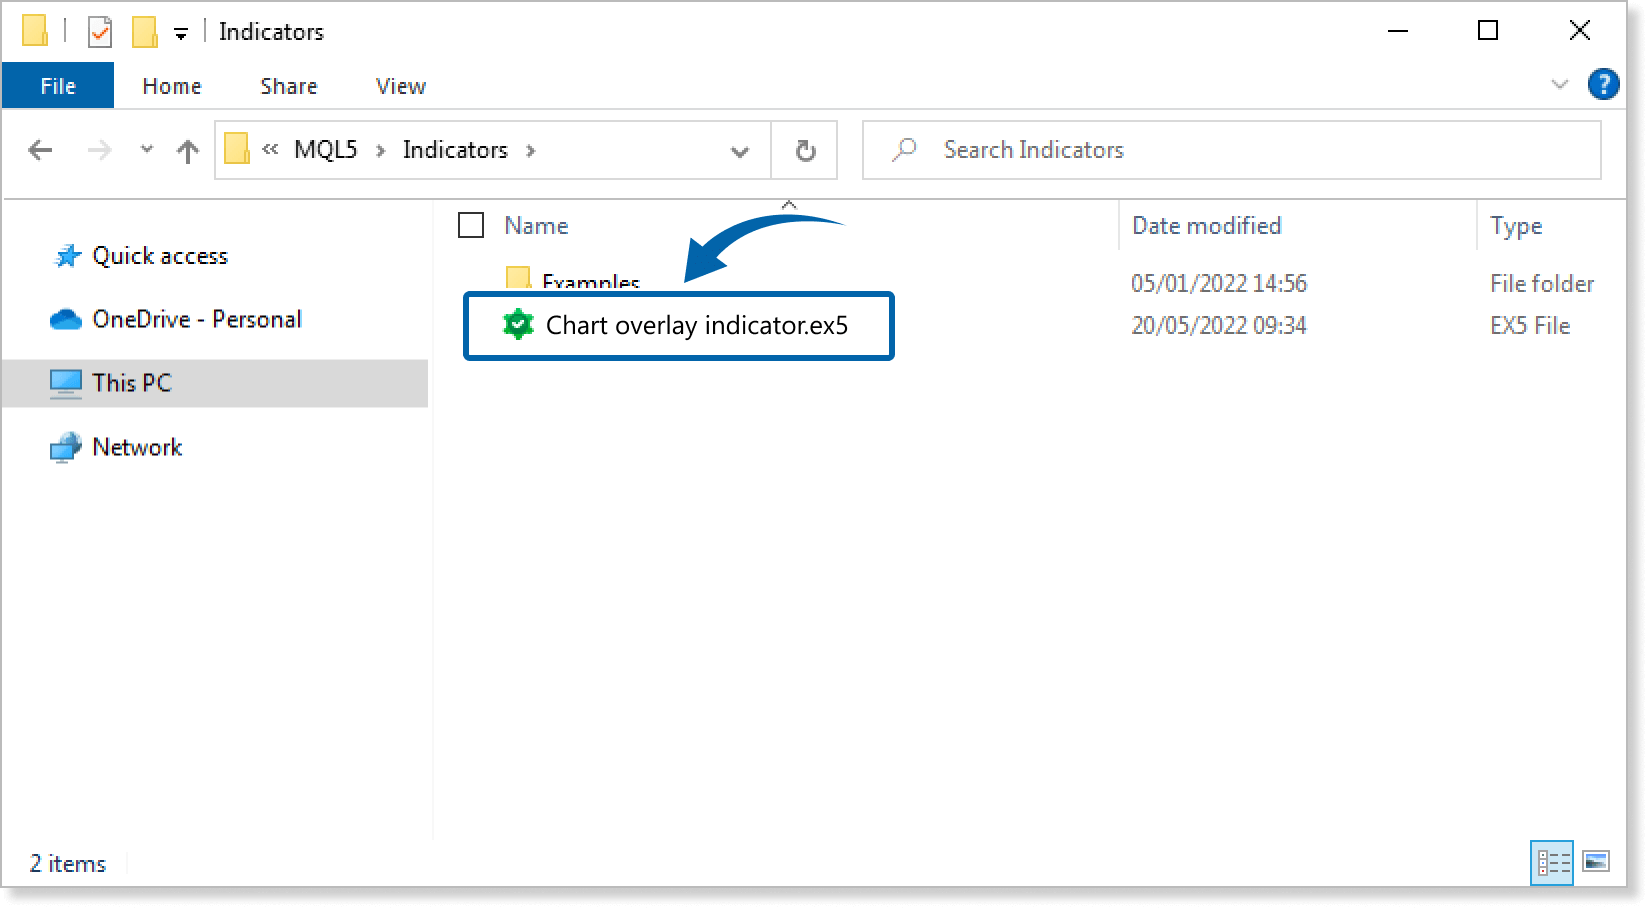
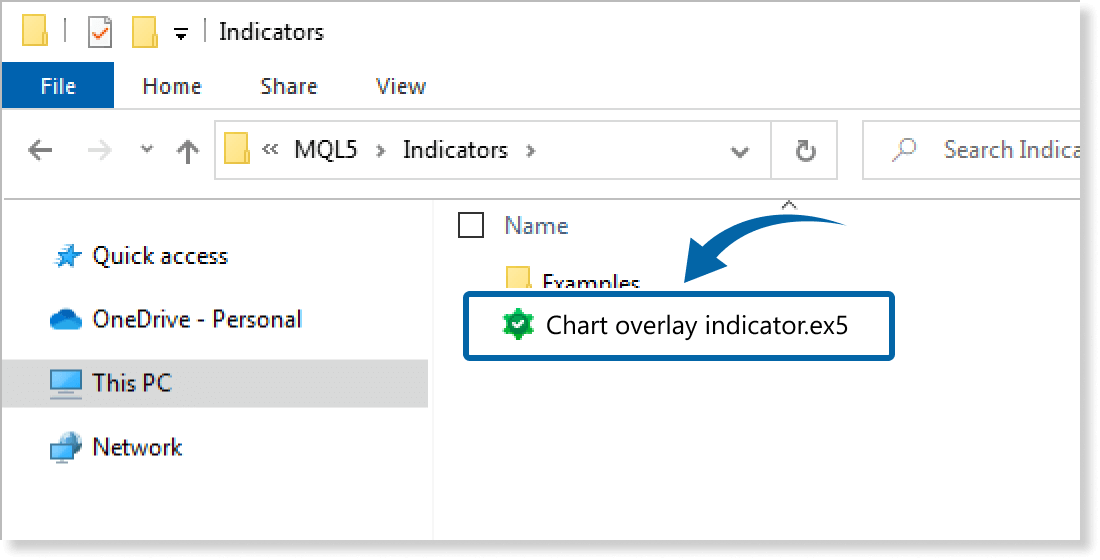
Step 5
Save the Chart Overlay Indicator in the Indicators folder.
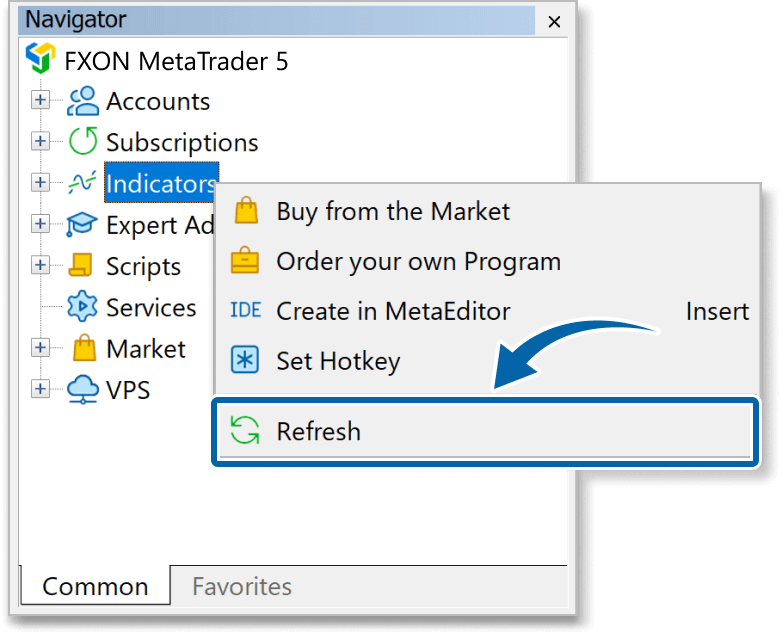
Step 6
Go back to the MT4/MT5. Right-click Indicators in the Navigator, and click Refresh.
Step 7
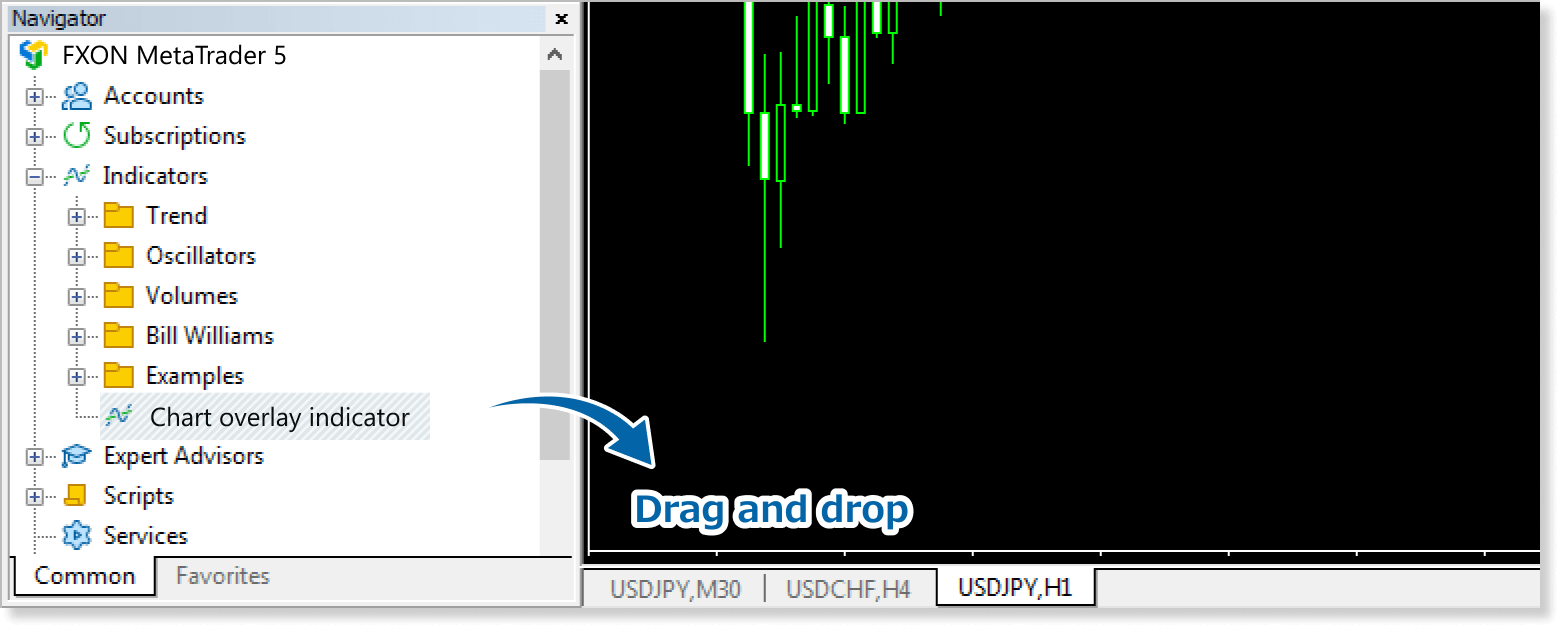
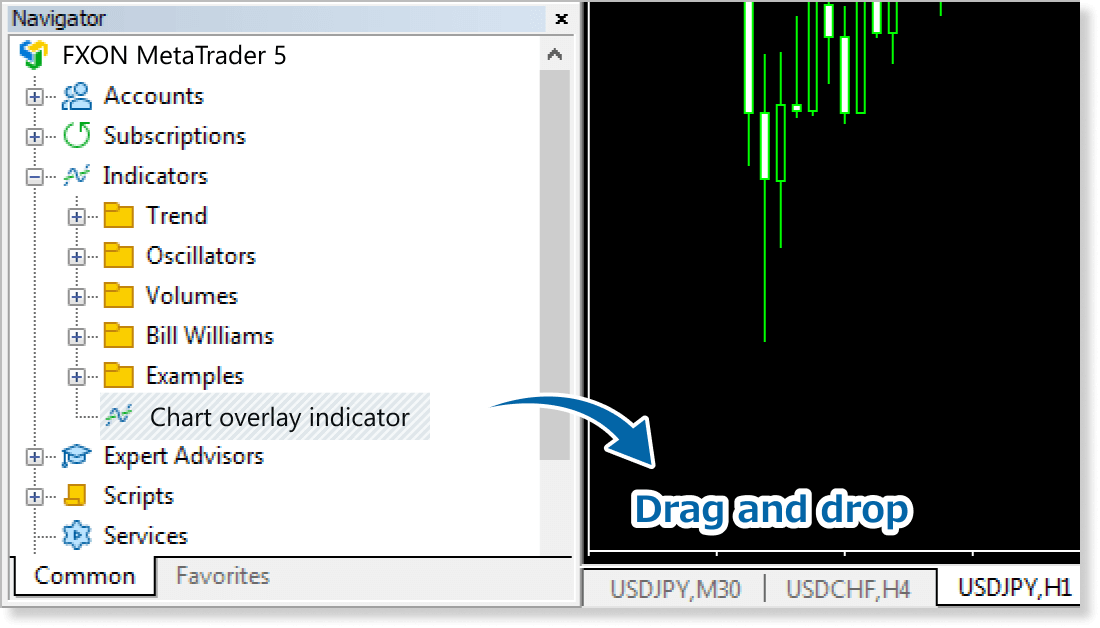
In the Navigator, click the + icon next to Indicators. Find the Chart Overlay Indicator, then either double-click it or drag it onto a chart.
Step 8
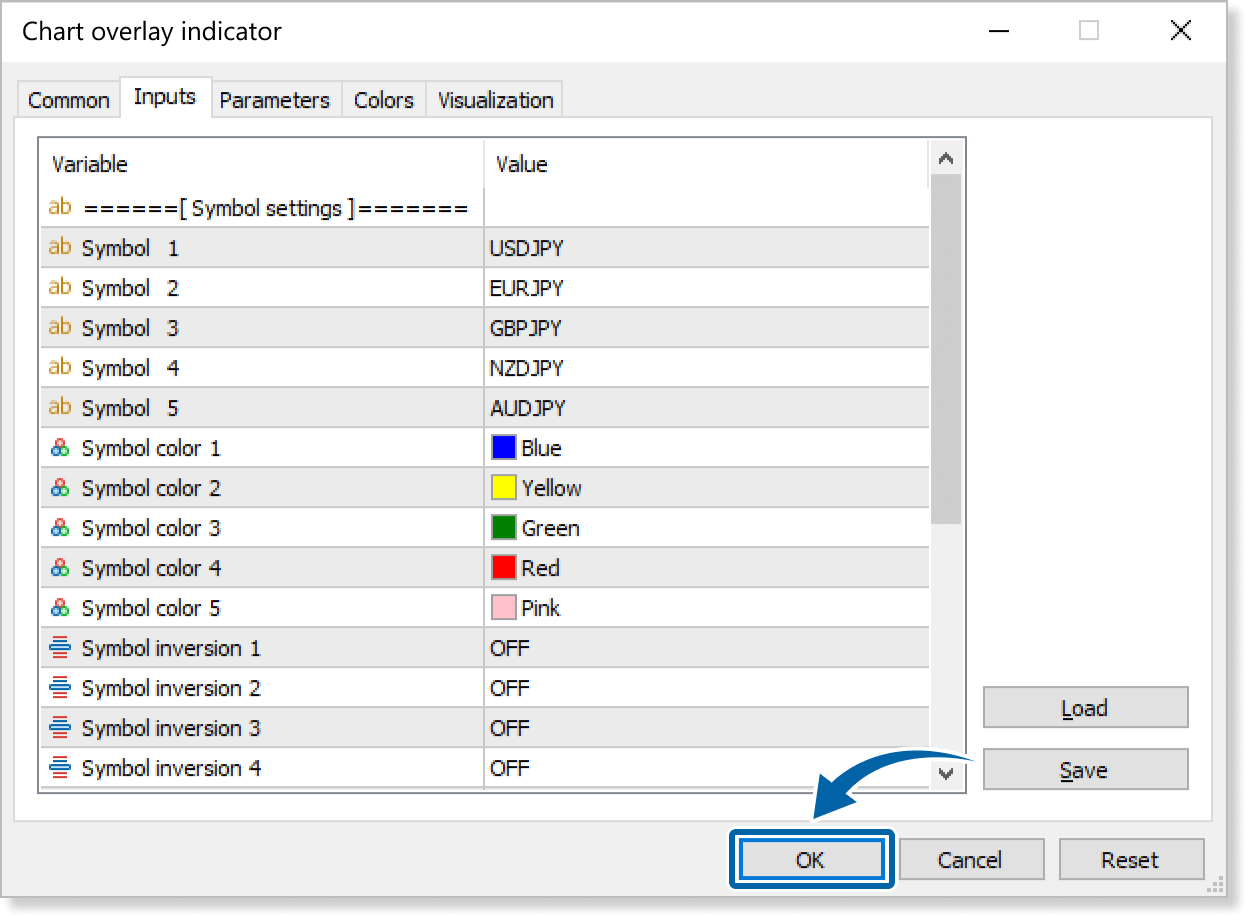
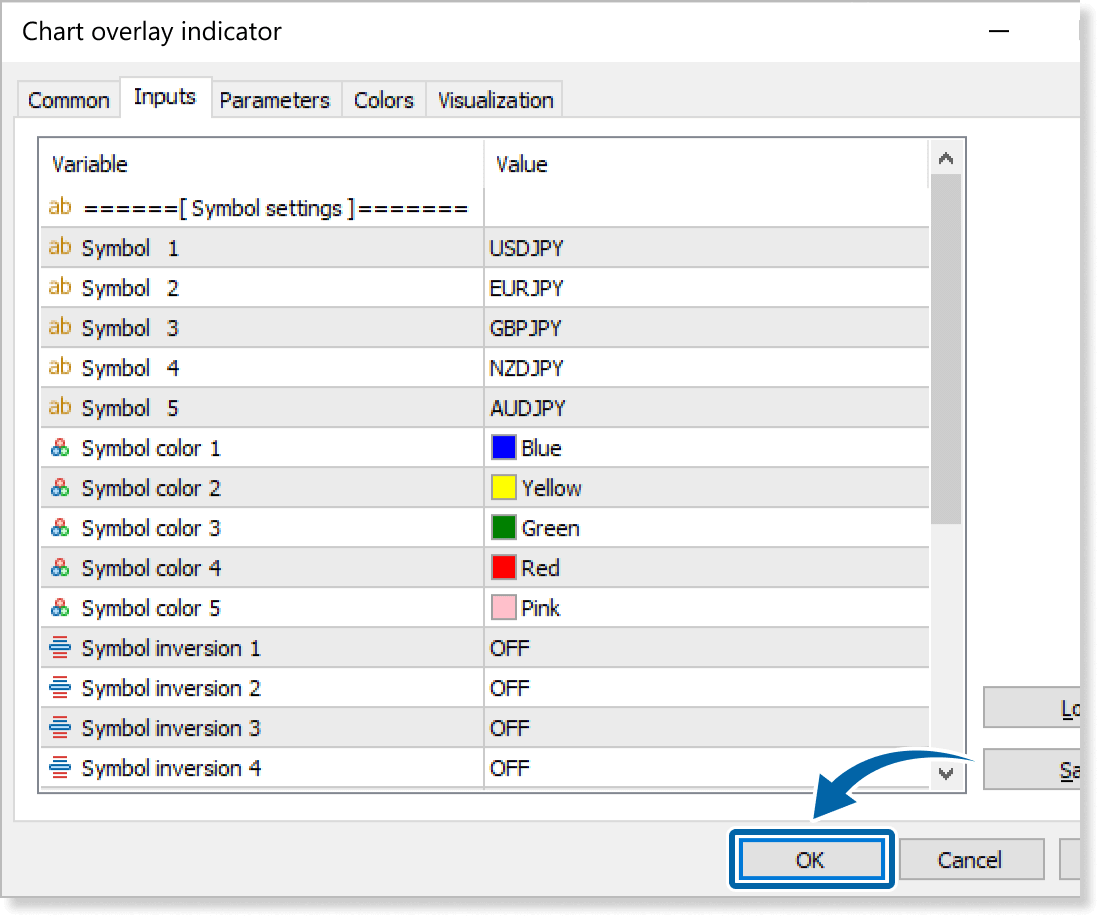
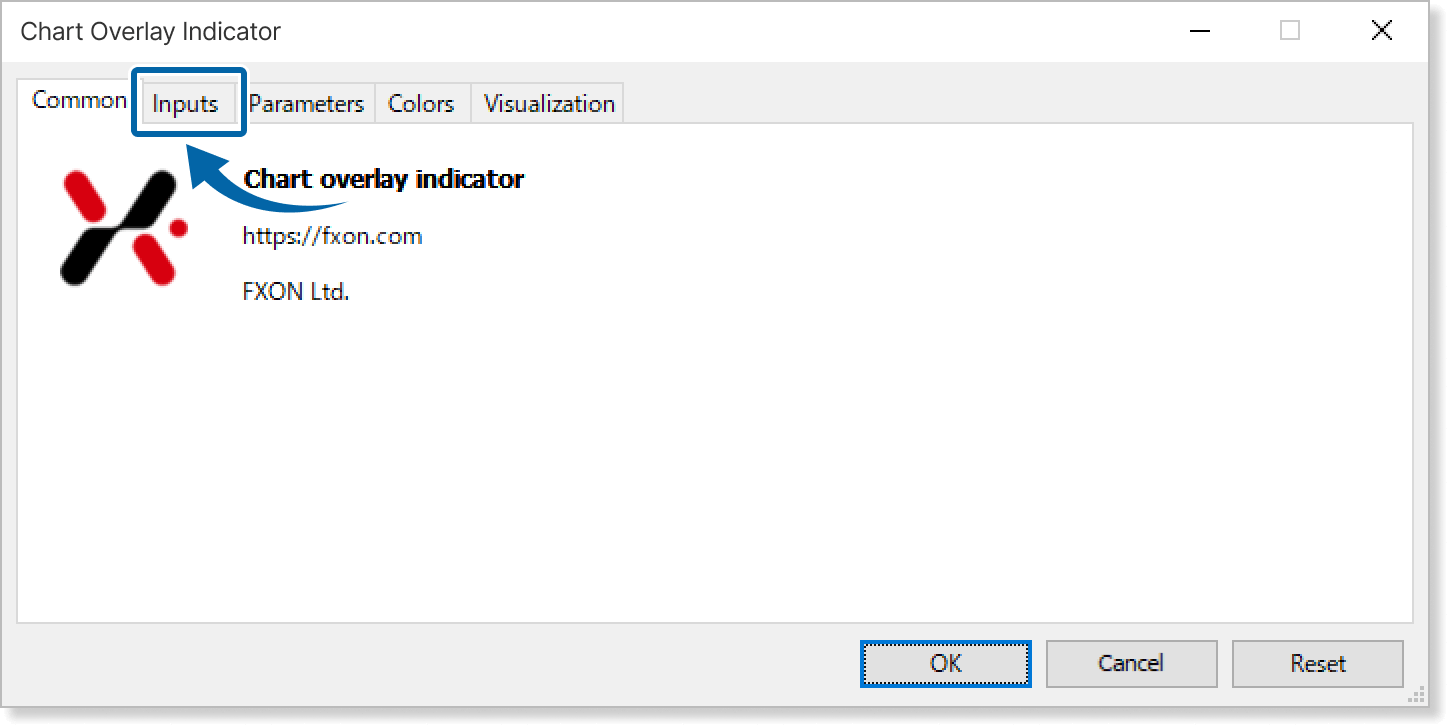
In the indicator settings window, customize the settings on the Inputs tab according to the How to set up page, then click OK.
Step 9
The Chart Overlay Indicator will be applied to the chart, displaying the charts of different instruments.
How to set up
After applying the indicator to the chart, set the parameters according to your style.
Step 1
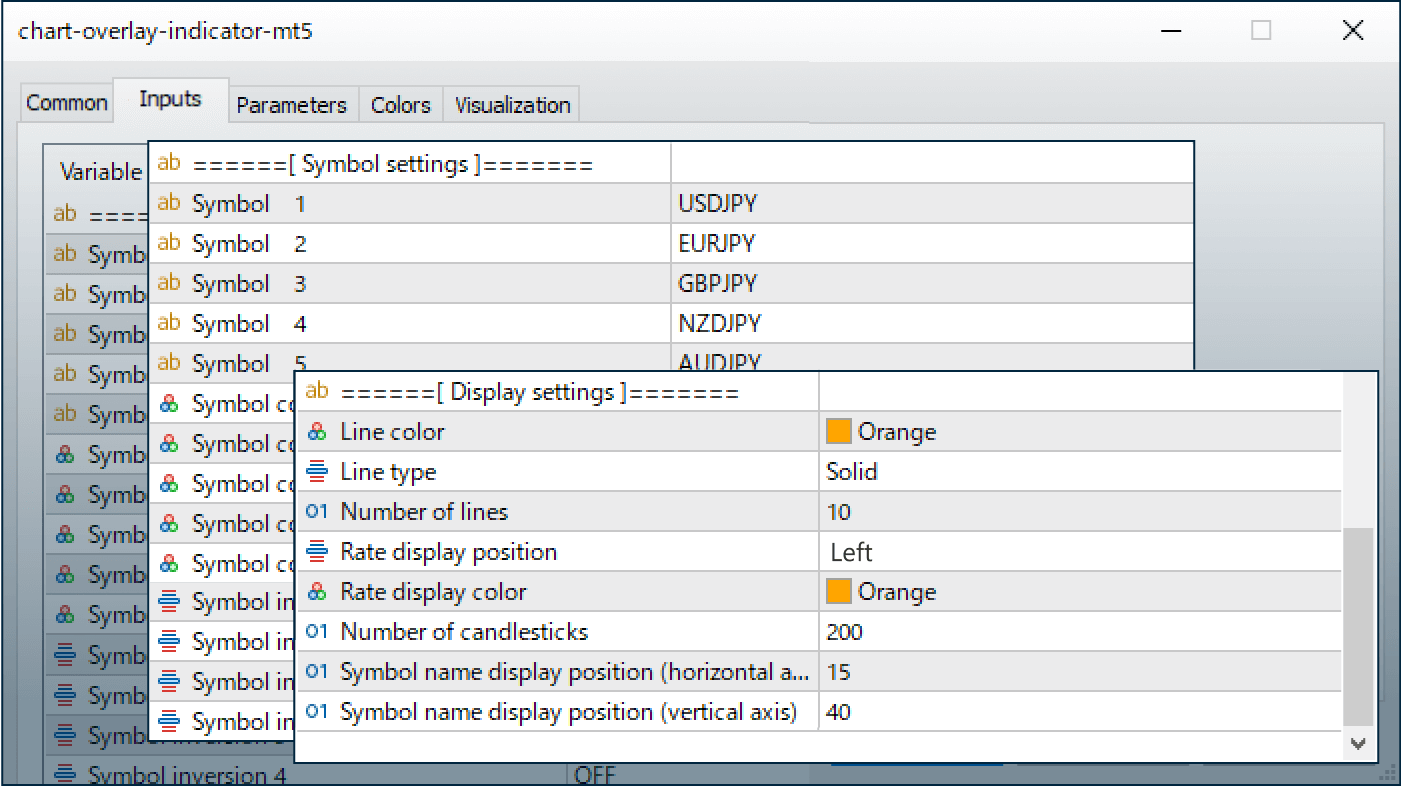
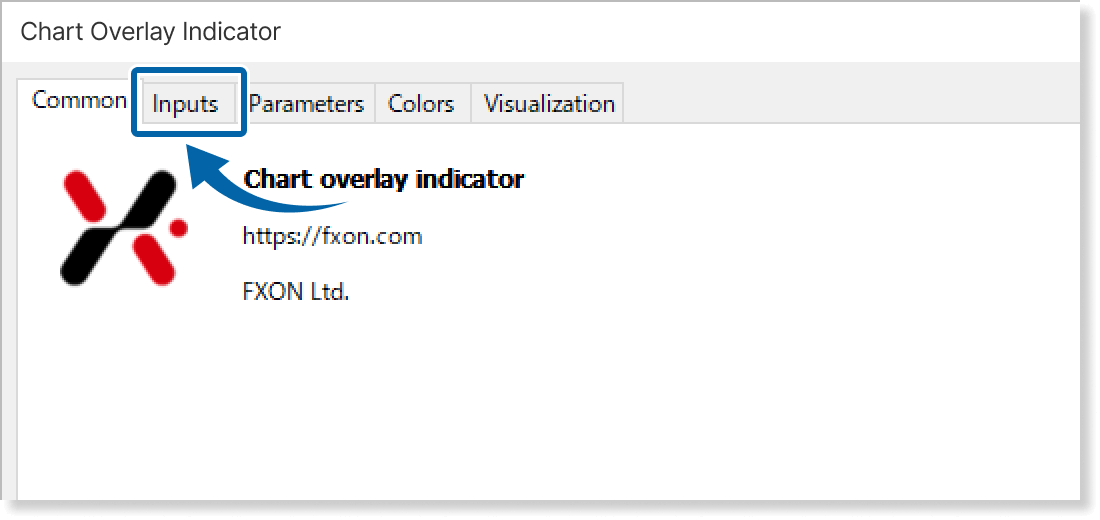
First, open the Inputs tab.
Step 2
Set the parameters as follows.
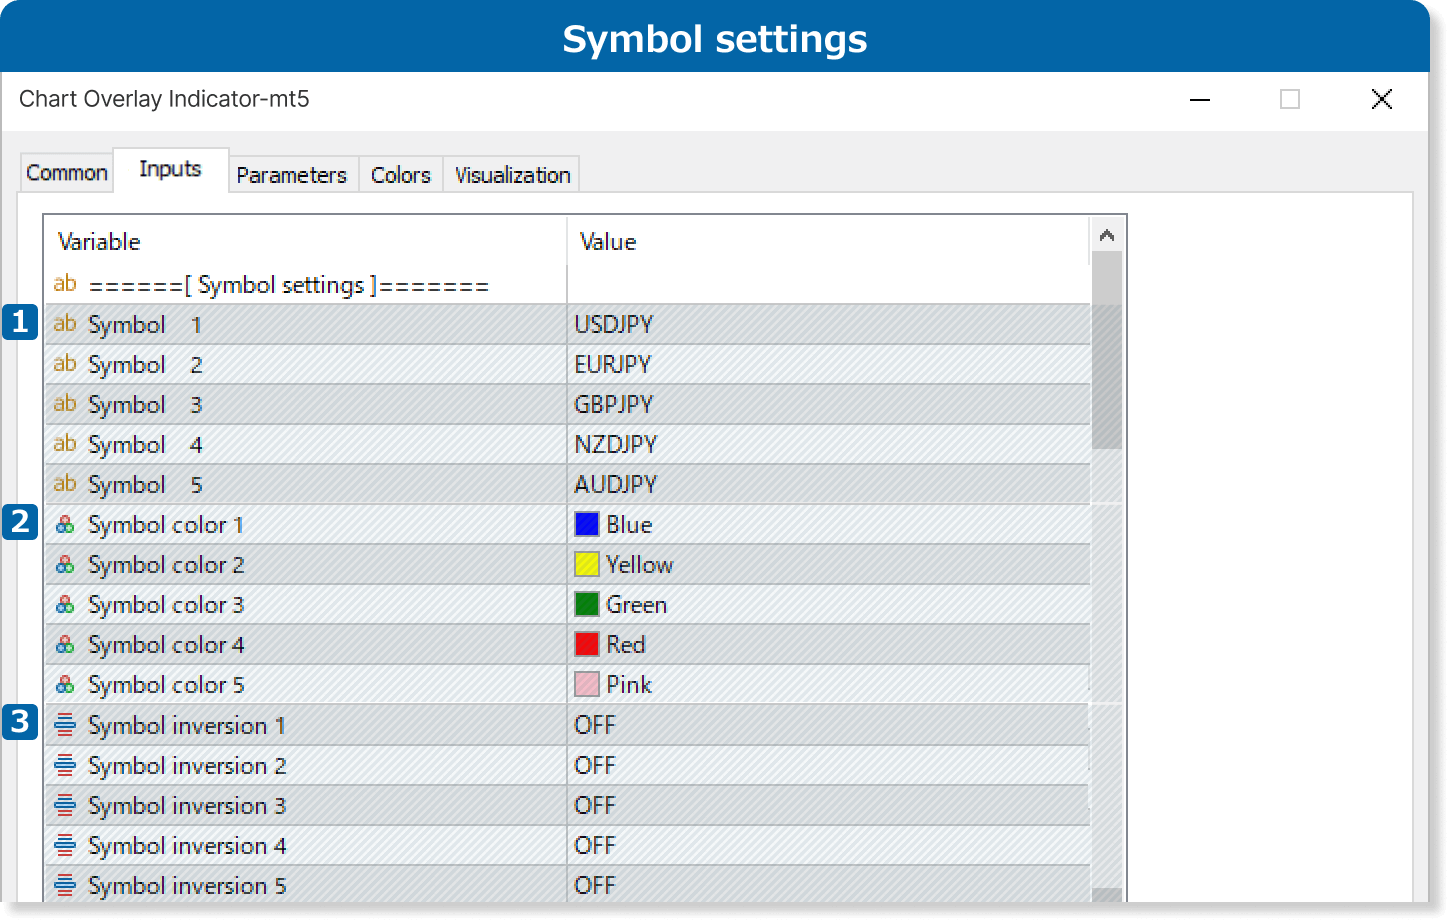
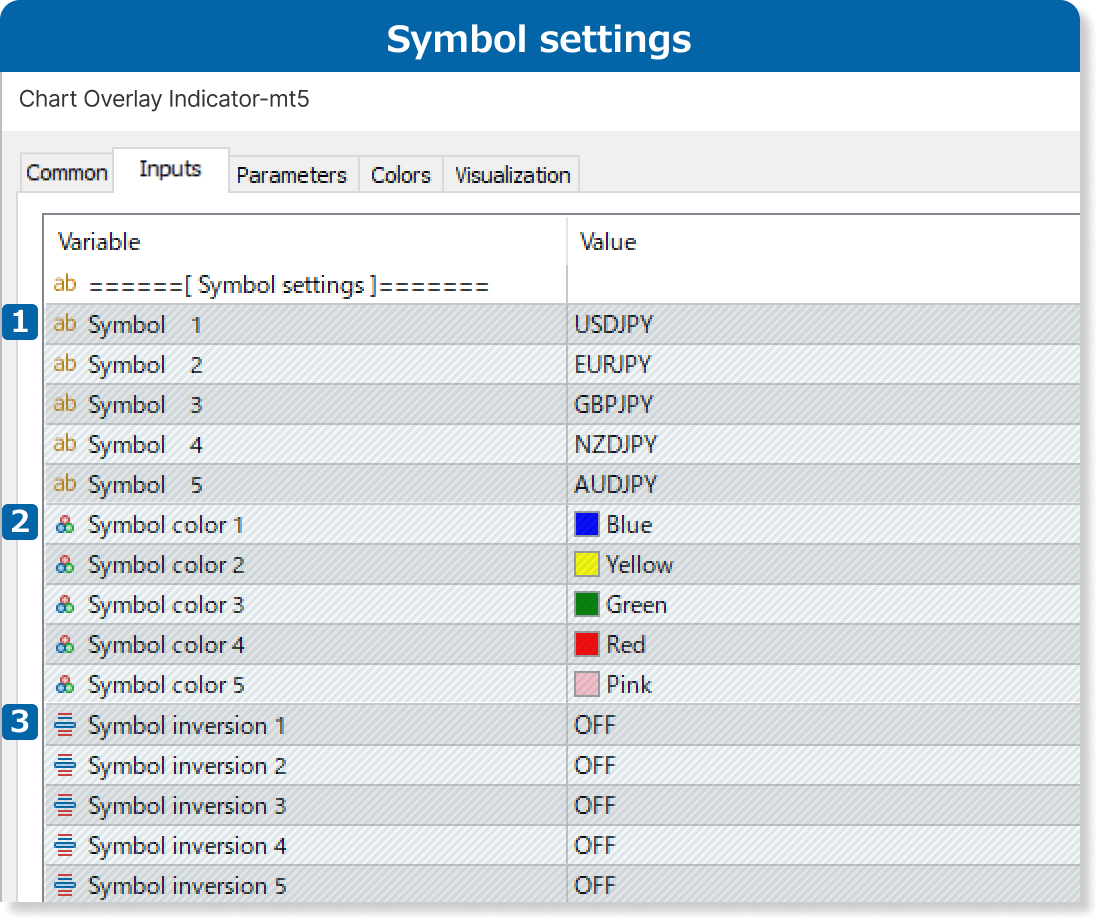
①Symbol
Specify the symbol name including suffix (characters after the symbol name).
②Symbol color
Set the color for charts to display.
③Symbol inversion
Enable/disable inversion for the currency pairs. If it's ON, USD/JPY will be converted into JPY/USD.
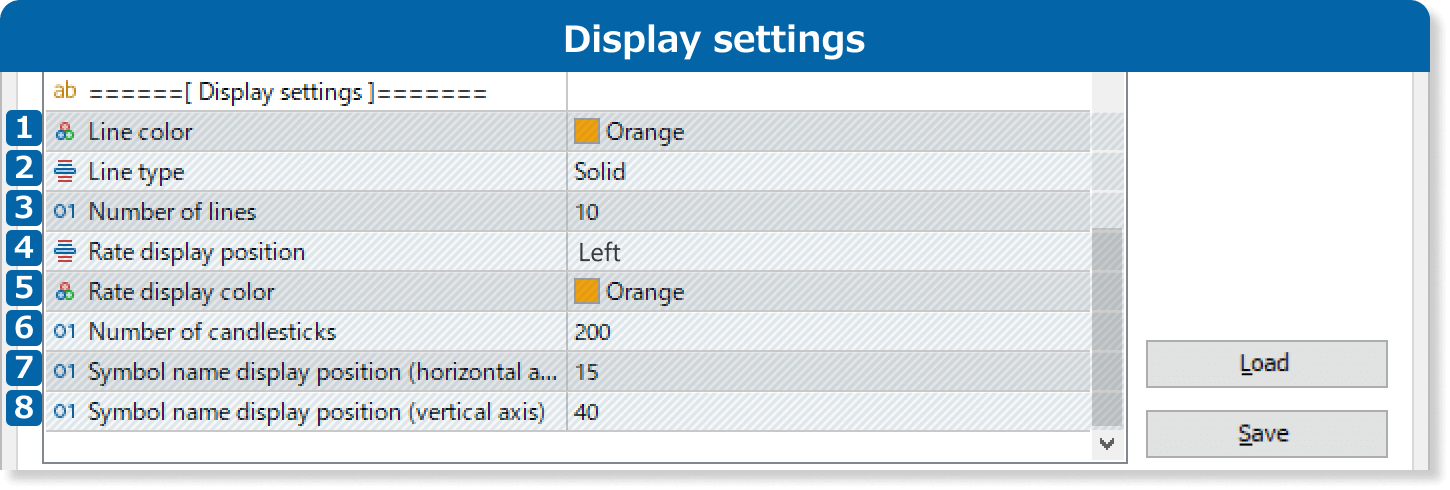
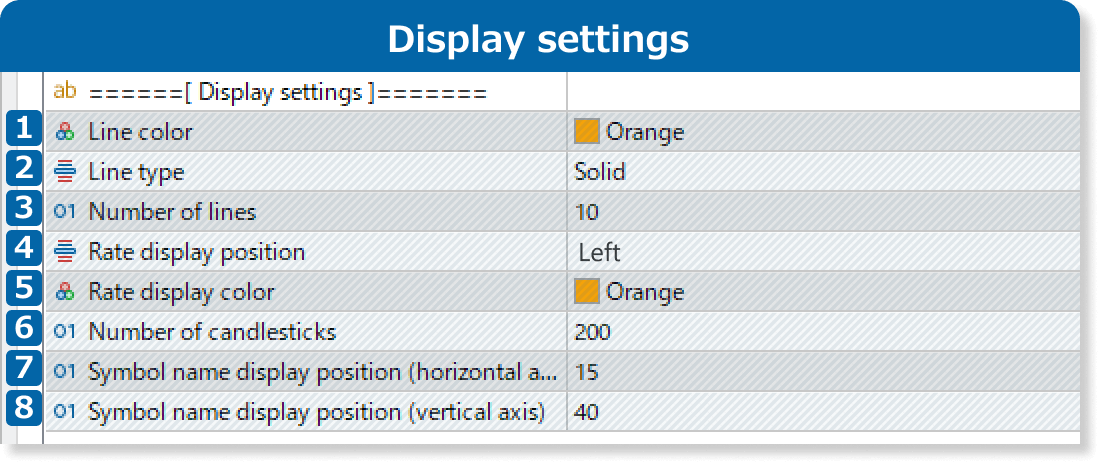
①Line color
Set the color of the rate line.
②Line type
Set the line type of the rate line.
③Number of lines
Specify the number of rate lines.
④Rate display position
Set the position of the rate display. Please choose either "Left" or "Right".
⑤Rate display color
Set the color of the rate display.
⑥Number of candlesticks
Specify the number of candlesticks of the overlaying charts. Example: if you enter "200", the chart will be displayed up to the 200th candlestick back from the current one.
⑦Symbol name display position(horizontal axis)
Specify the position of symbol names on the horizontal axis. They correspond to the color of each chart. 0 is at the rightmost position and increasing the number moves it to the left.
⑧Symbol name display position(vertical axis)
Specify the position of symbol names on the vertical axis. They correspond to the color of each chart. 0 is at the top position and increasing the number moves it to the lower.