


#supportive
#mainchart
#supportive
#mainchart
Downloaded:
0
times
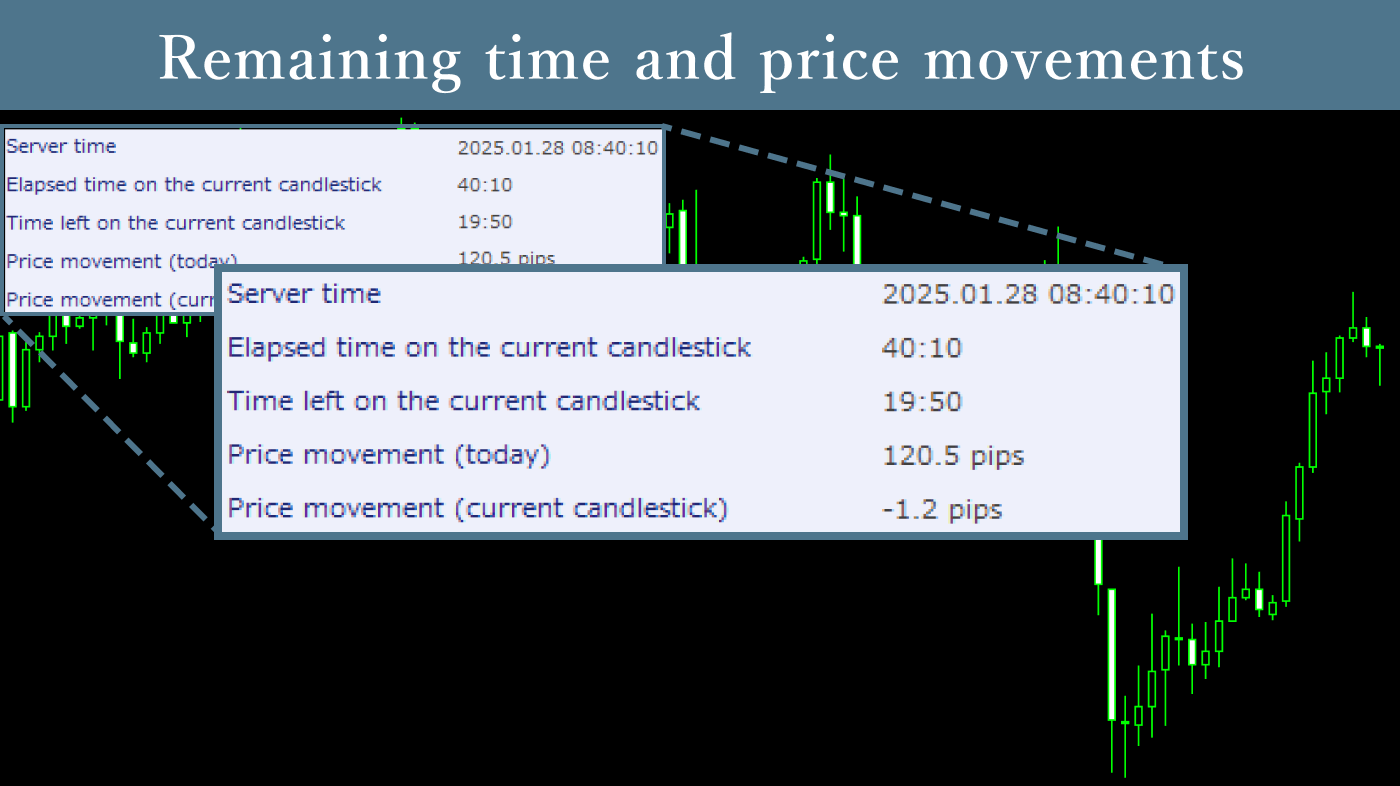
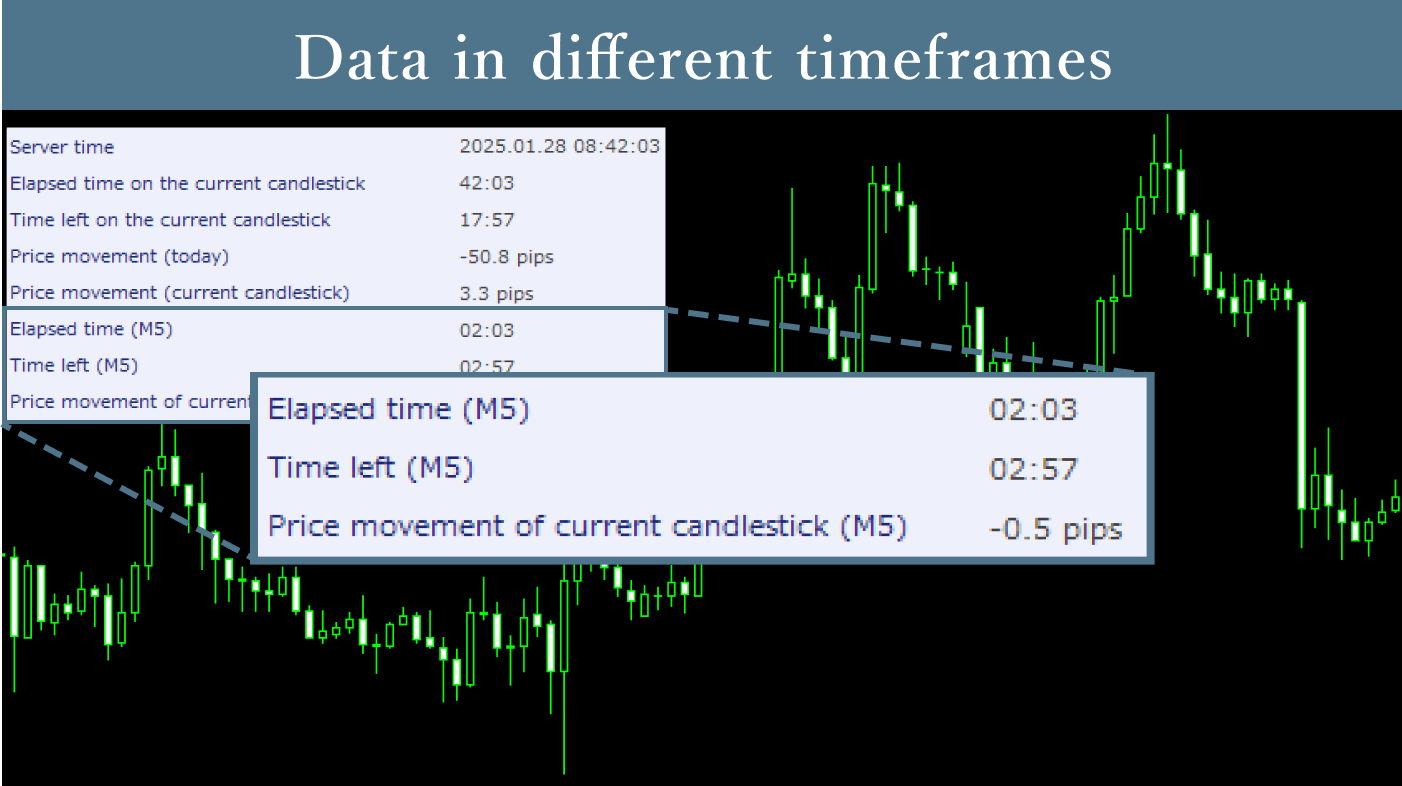
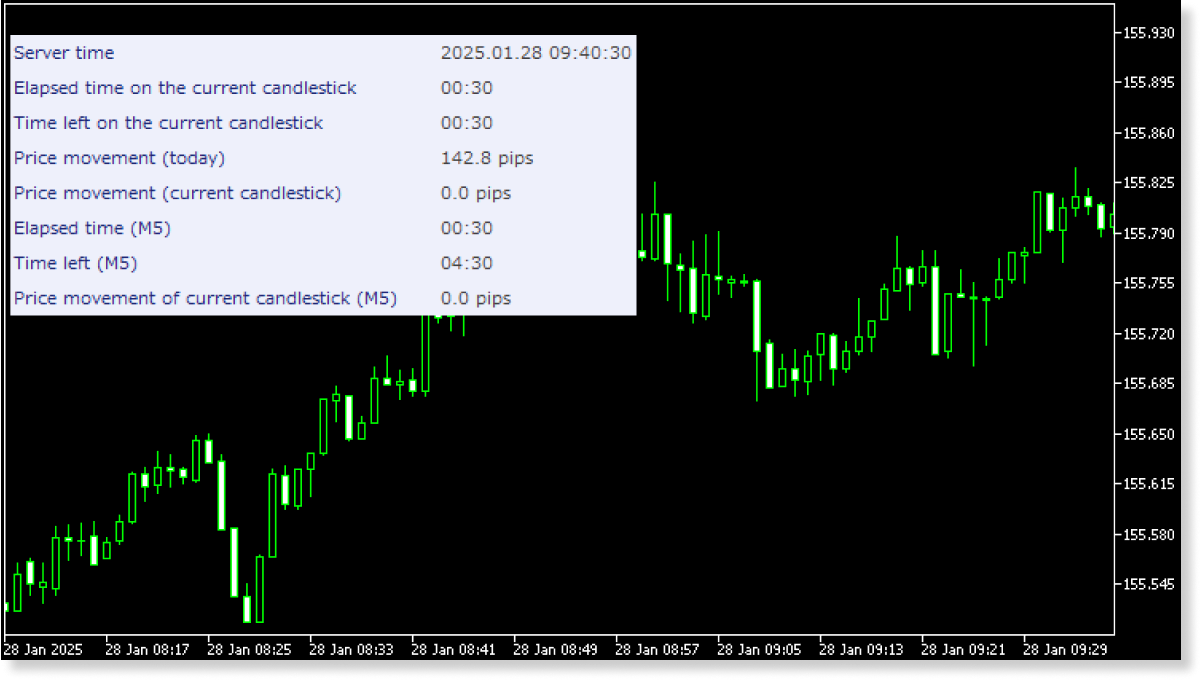
The Remaining Time Indicator displays the time until switching from the current bar to the next bar, and price movements in the current bar. Additionally, it can display information for specific timeframes regardless of the chart's timeframe, which can be useful for understanding trading timing.
Downloaded:
0
times
Usage scenarios
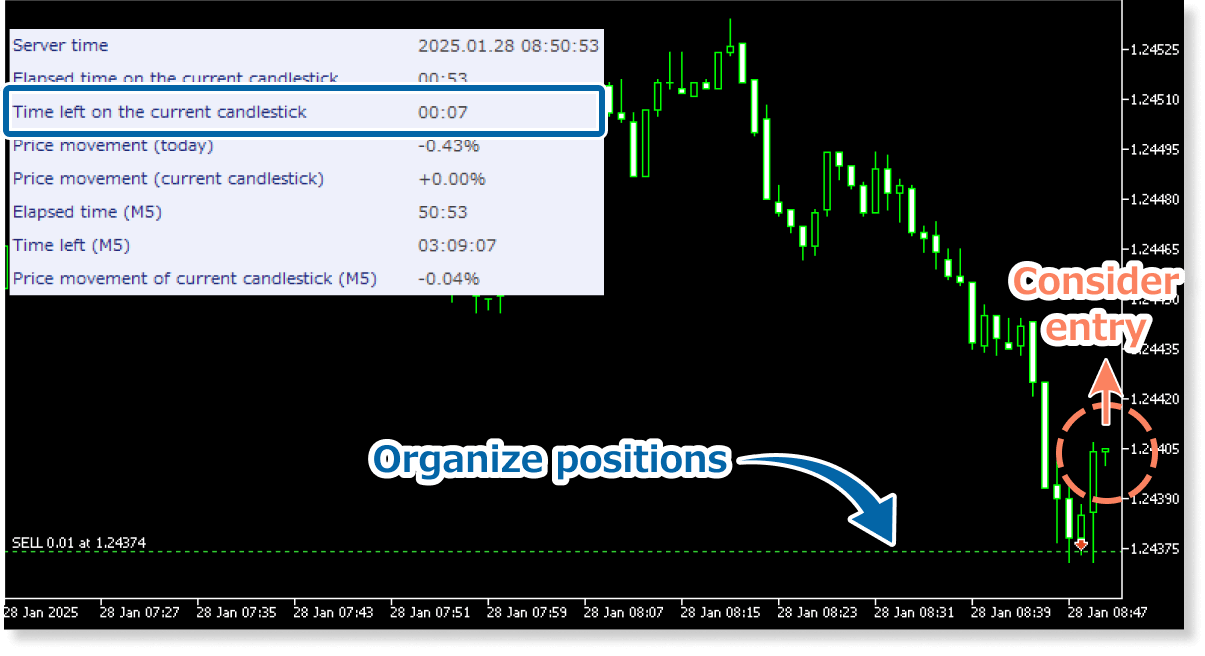
For trading at new candlestick timing
Since large price movements tend to occur near the end of bars, understanding the remaining time in the current bar makes it easier to implement trading strategies targeting breakouts. Additionally, it can be used to organize existing positions before such price movements occur.
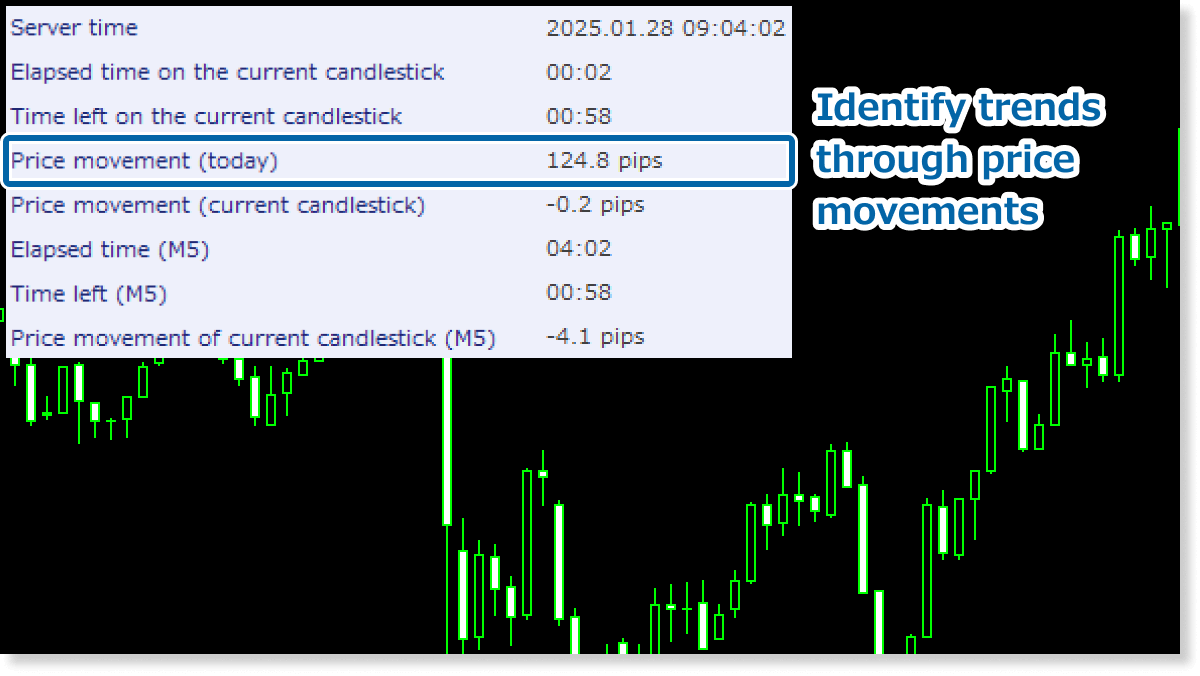
Understanding general trends from higher timeframe price movements
By checking the day's movements or movements in longer timeframes, it's possible to understand the general trend of the day. For example, you might determine an upward trend if the price has risen significantly on daily or weekly timeframes, or a range-bound market if there isn't much movement, and use this along with short-term technical indicators for trading decisions.
Understand the range of sharp drops/rises to set the TP line
The Remaining Time Indicator allows you to accurately understand price movements in the current bar in pips. Based on these numbers, you can use it to set TP or SL lines when, for example, trading the rebound after large price movements from economic indicator releases.
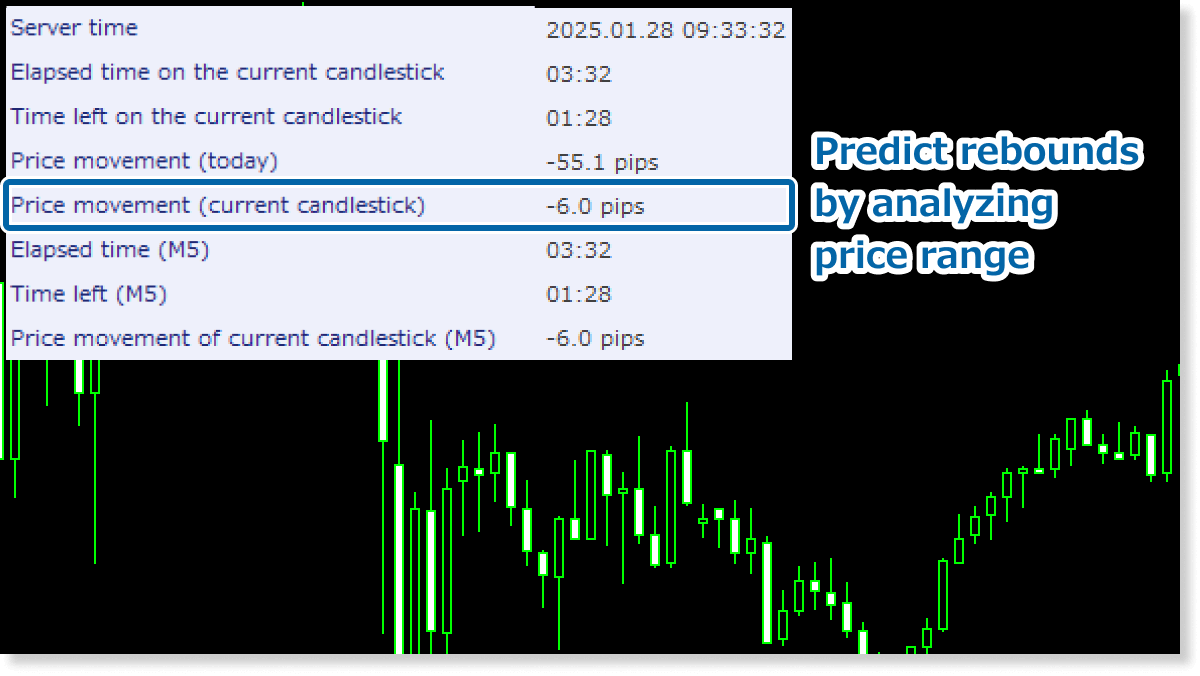
The characteristic of the Remaining Time Indicator is that you can quickly check current bar information all at once, such as time until bar changes and price movements. If you want to constantly monitor bar change timing and the range of price movements, please make use of this tool.
The pip size in the Remaining Time Indicator is 0.01 for symbols with three decimal places and 0.0001 for those with five decimal places. For other symbols, it depends on the number of decimal places, such as 0.01 for two decimal places.
Keep in mind that some brokers might apply different pip sizes than those used by this indicator.
How to install
To use the Remaining Time Indicator, follow the steps below to download and install it.
Step 1
Click the button below to download the indicator for MT4/MT5.
Step 2
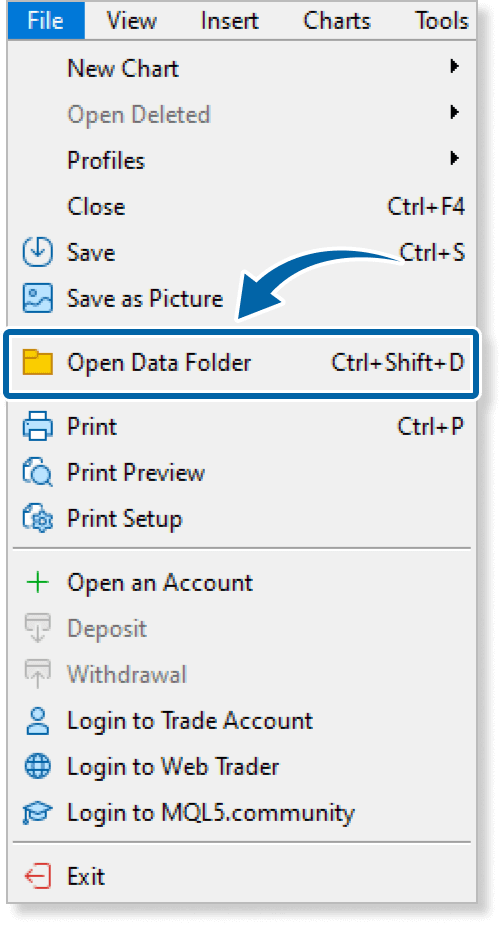
Click File > Open Data Folder in the top menu of MT4/MT5.
Step 3
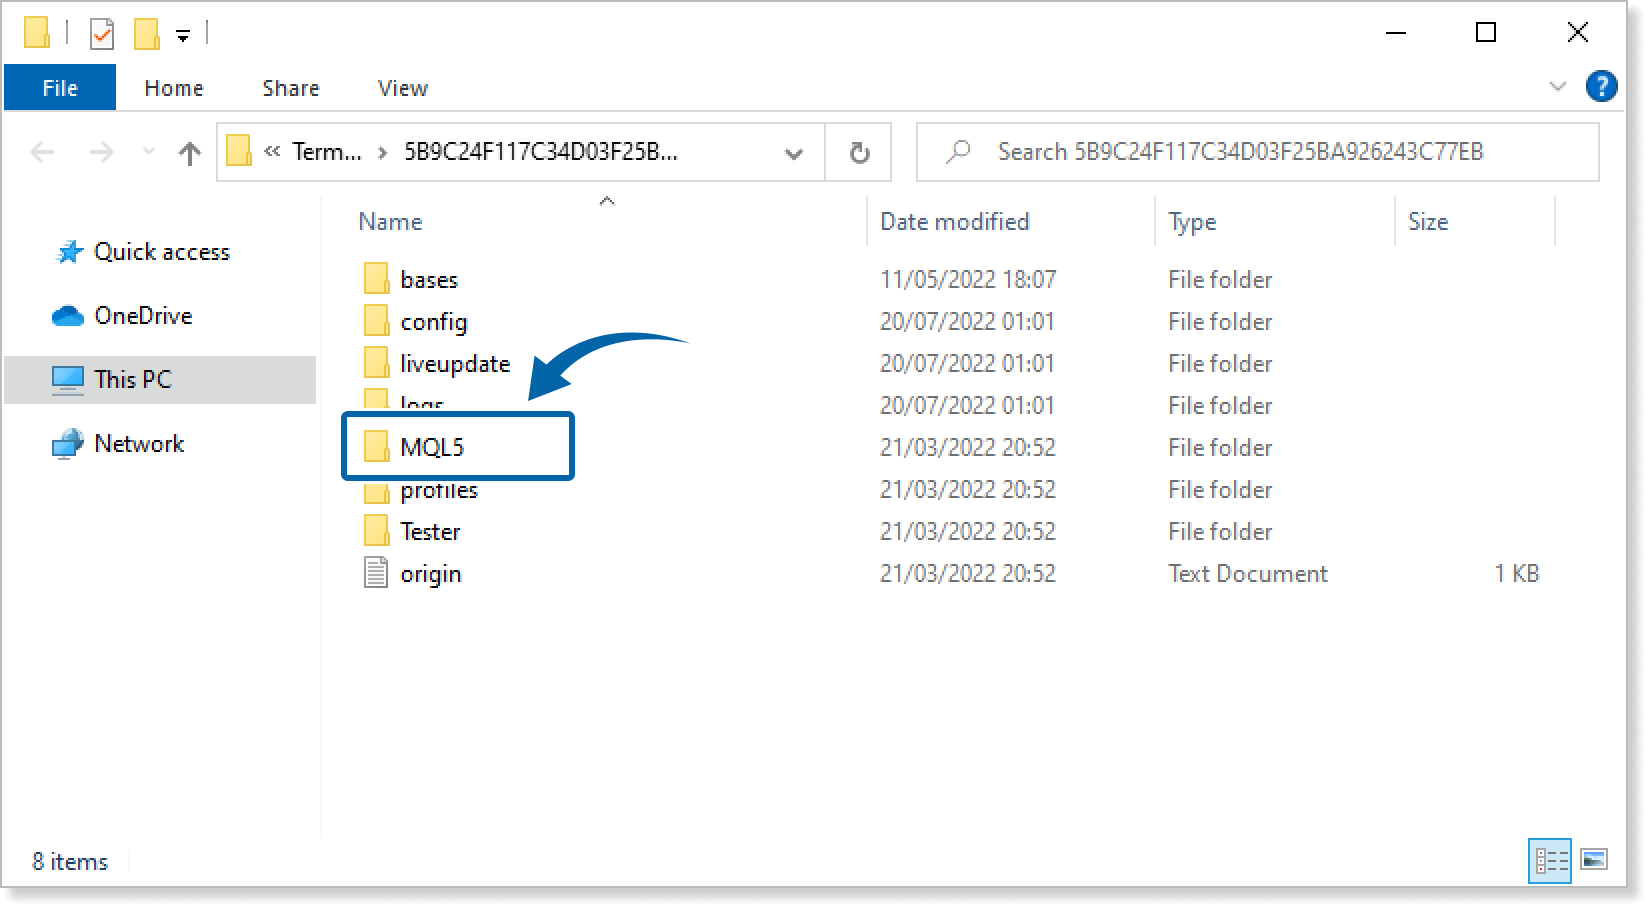
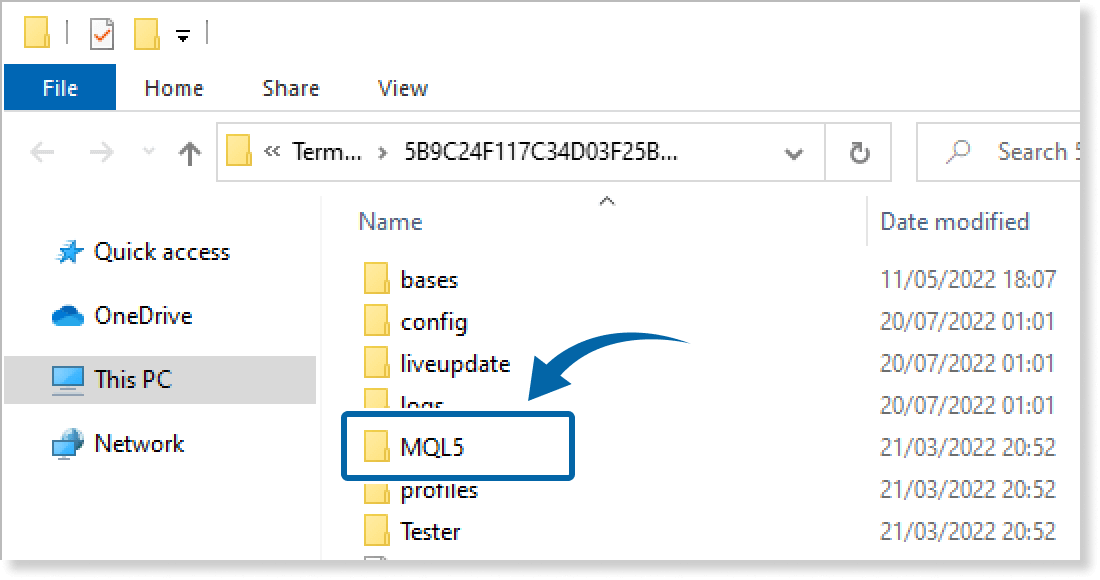
In the data folder, double-click the MQL4 or MQL5 folder.
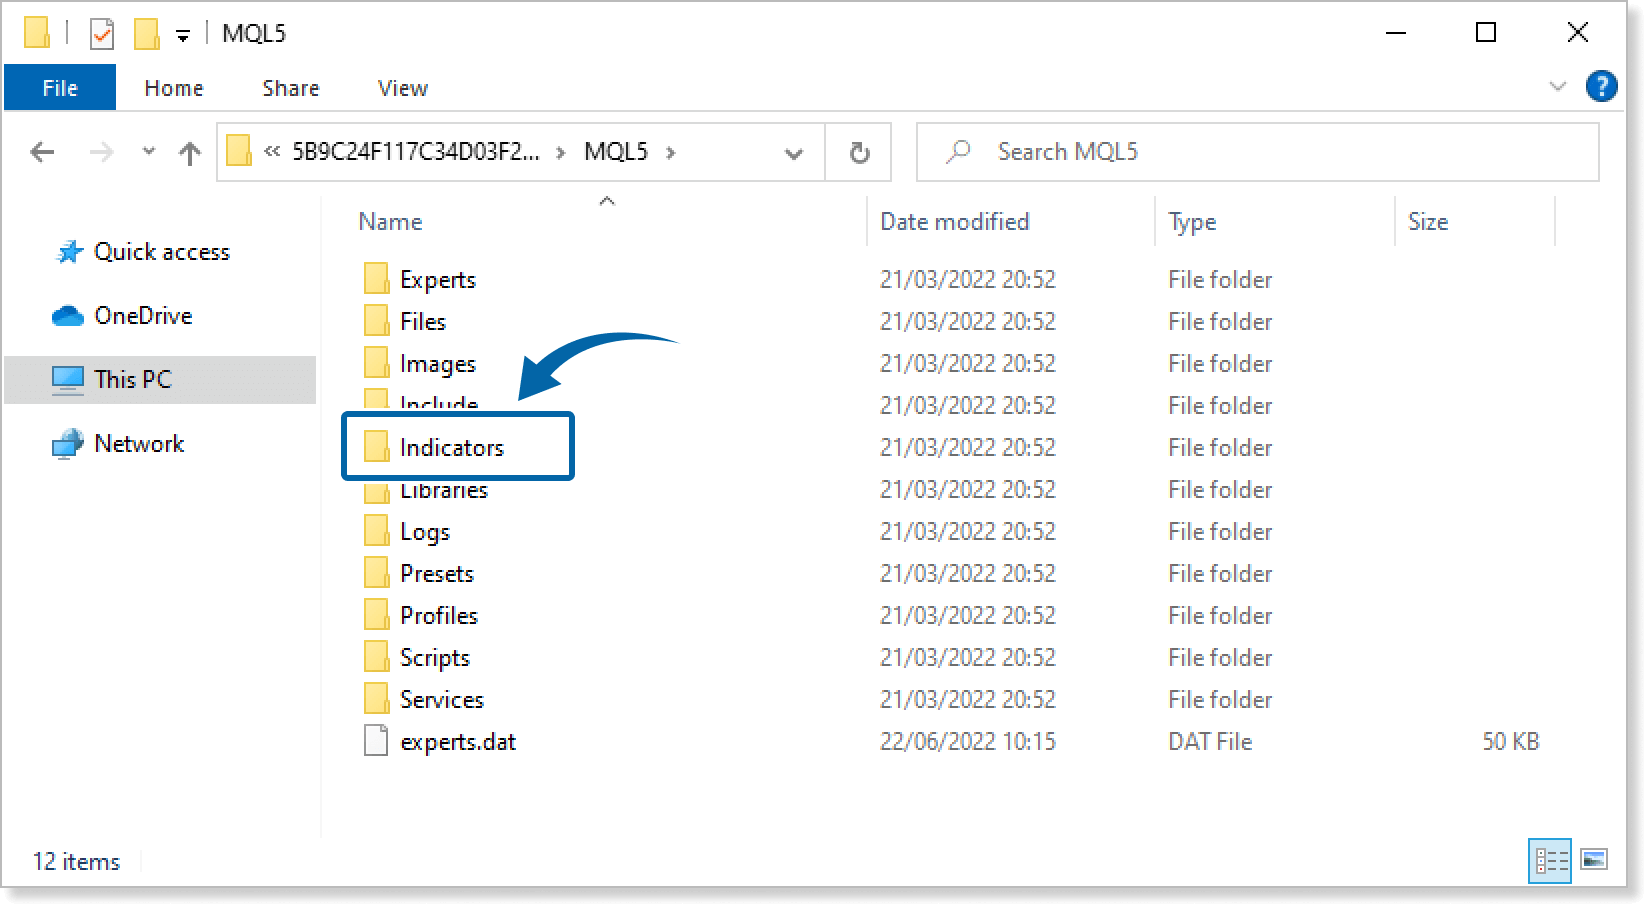
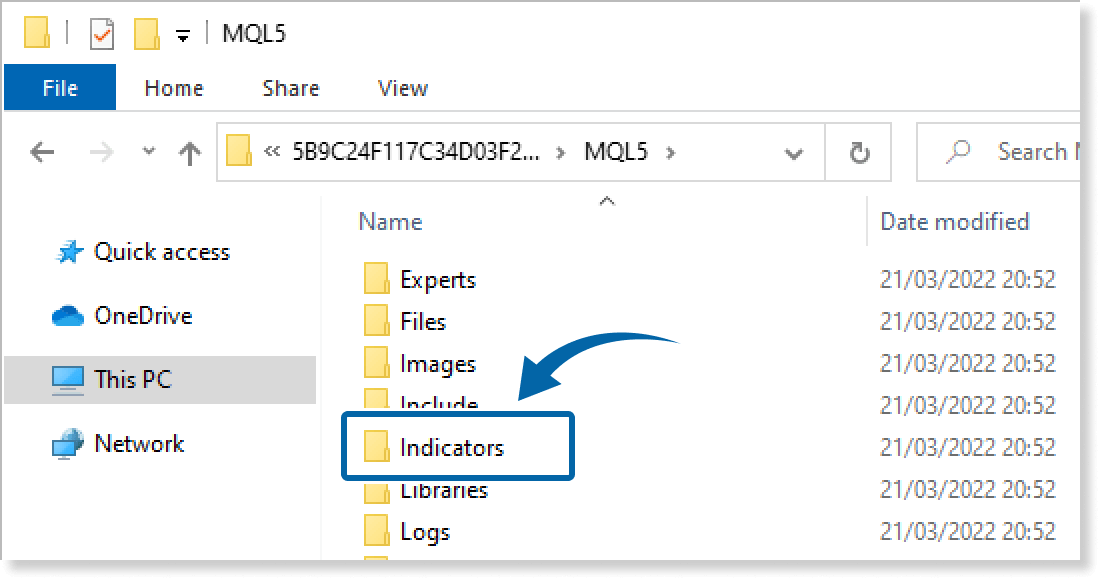
Step 4
In the MQL4/MQL5 folder, double-click the Indicators folder.
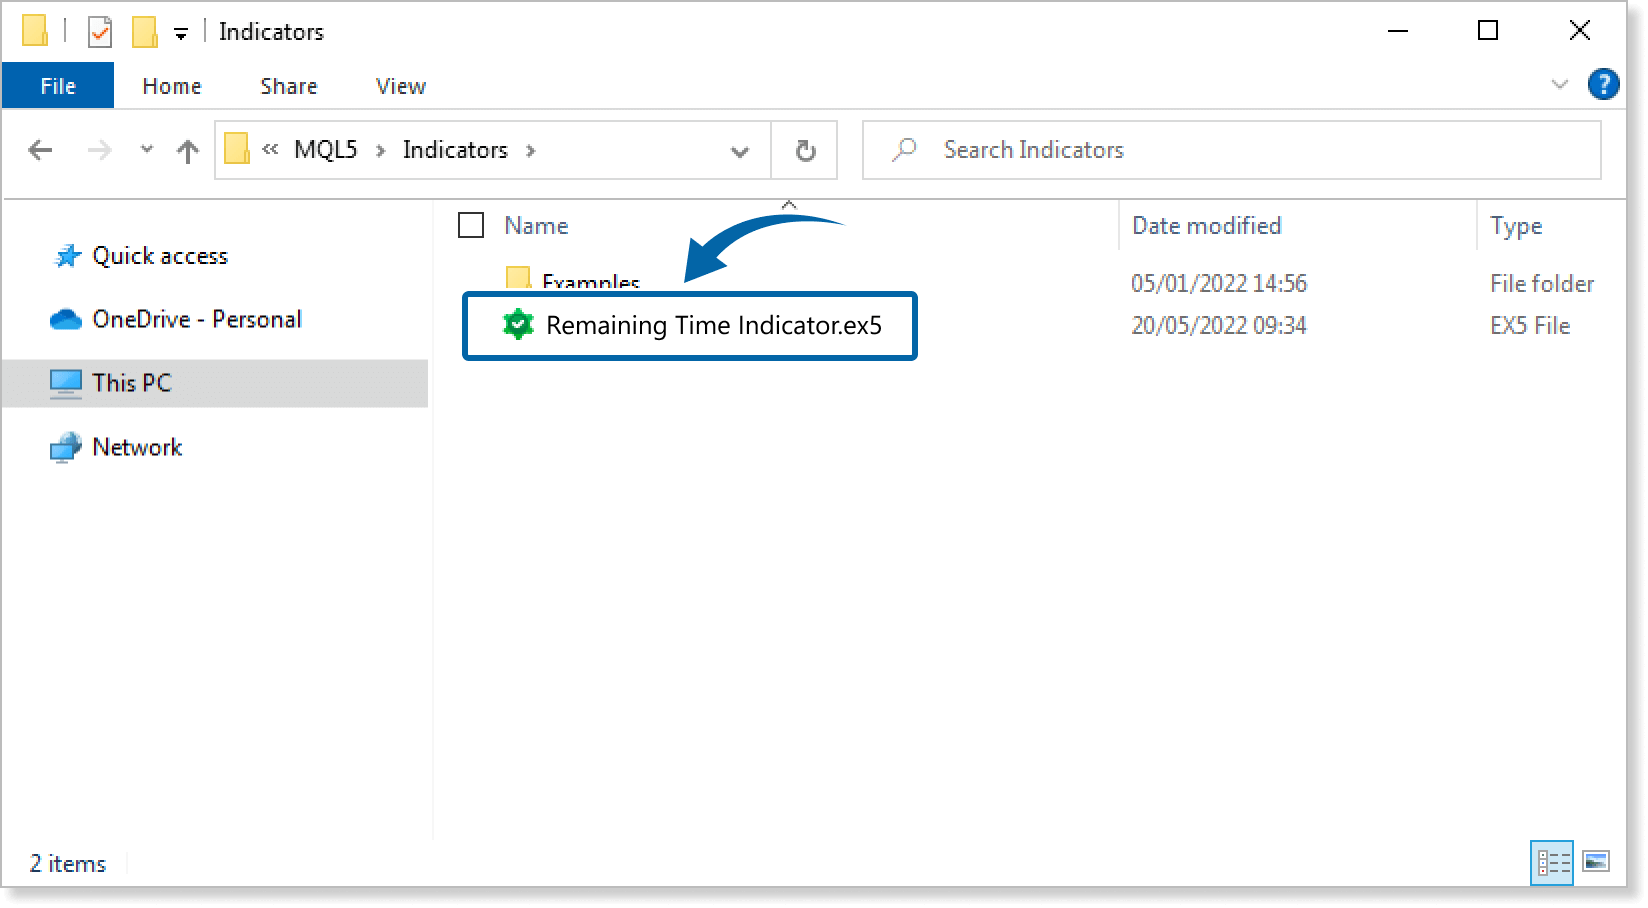
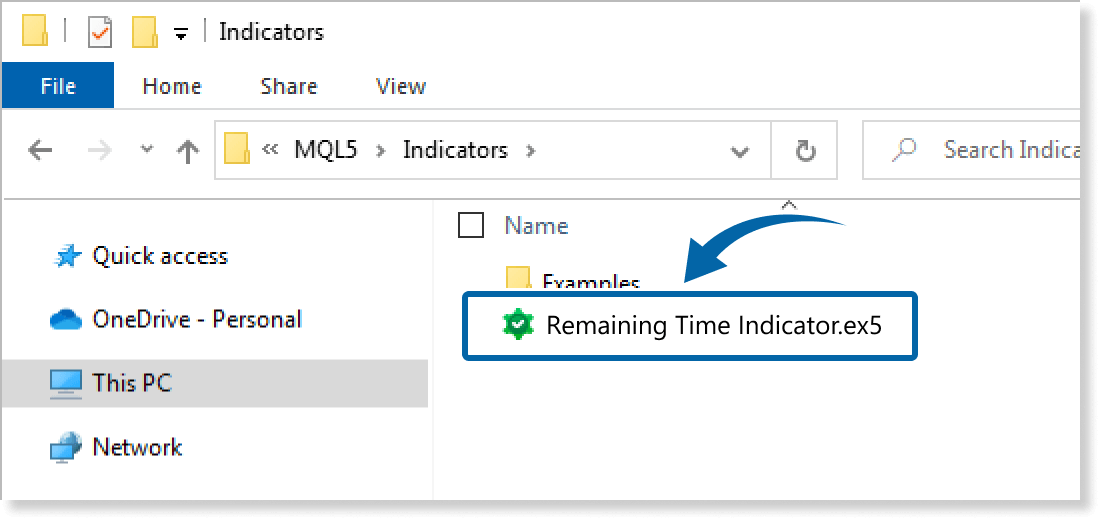
Step 5
Save the Remaining Time Indicator in the Indicators folder.
Step 6
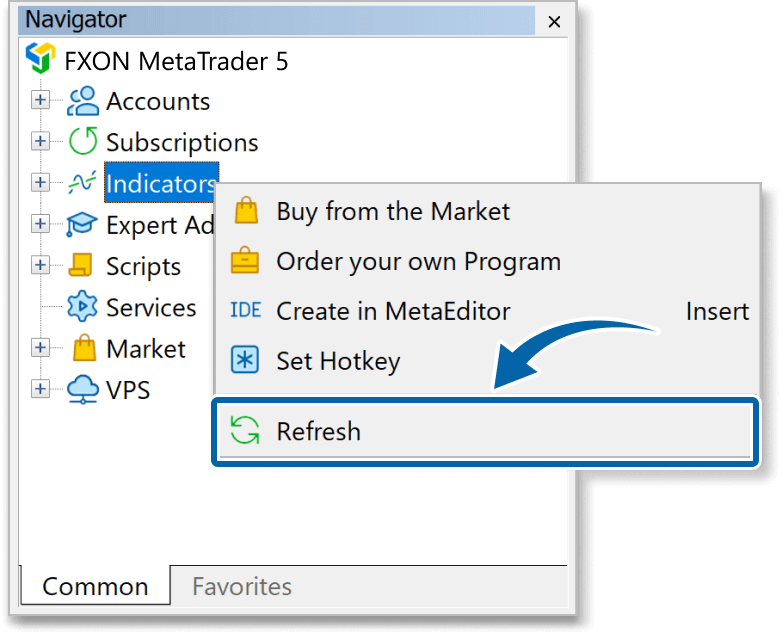
Go back to the MT4/MT5. Right-click Indicators in the Navigator, and click Refresh.
Step 7
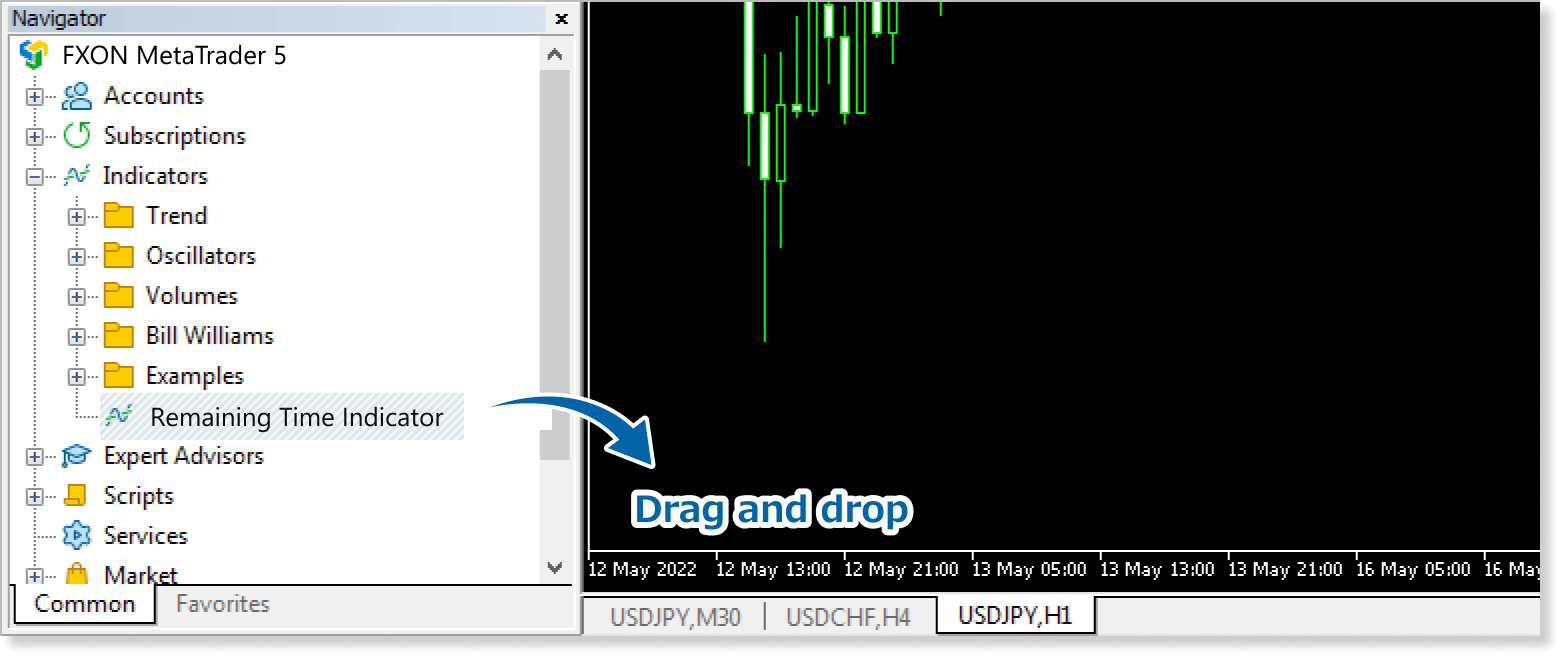
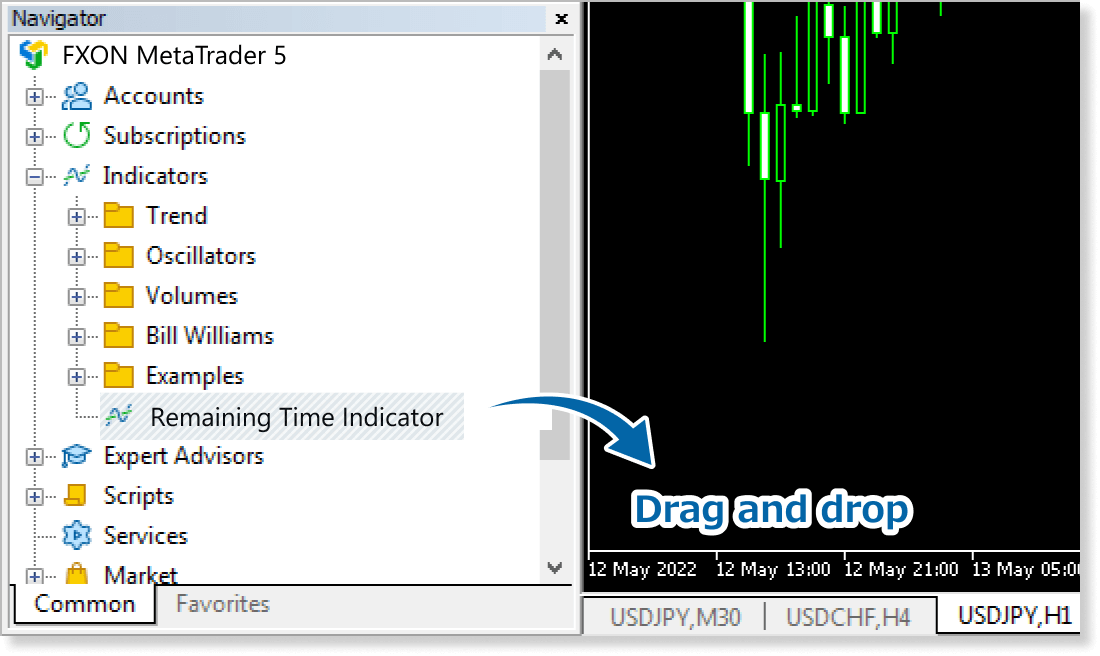
In the Navigator, click the + icon next to Indicators. Find the Remaining Time Indicator, then either double-click it or drag it onto a chart.
Step 8
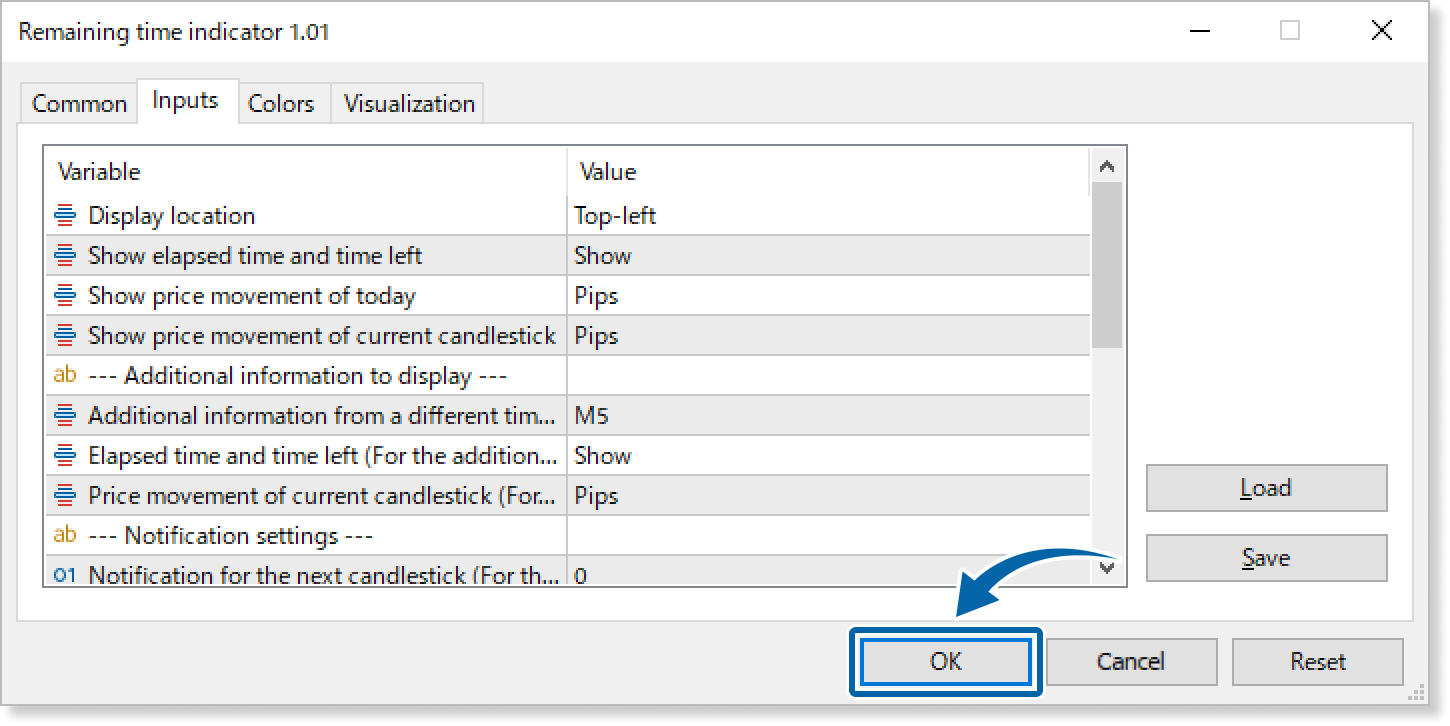
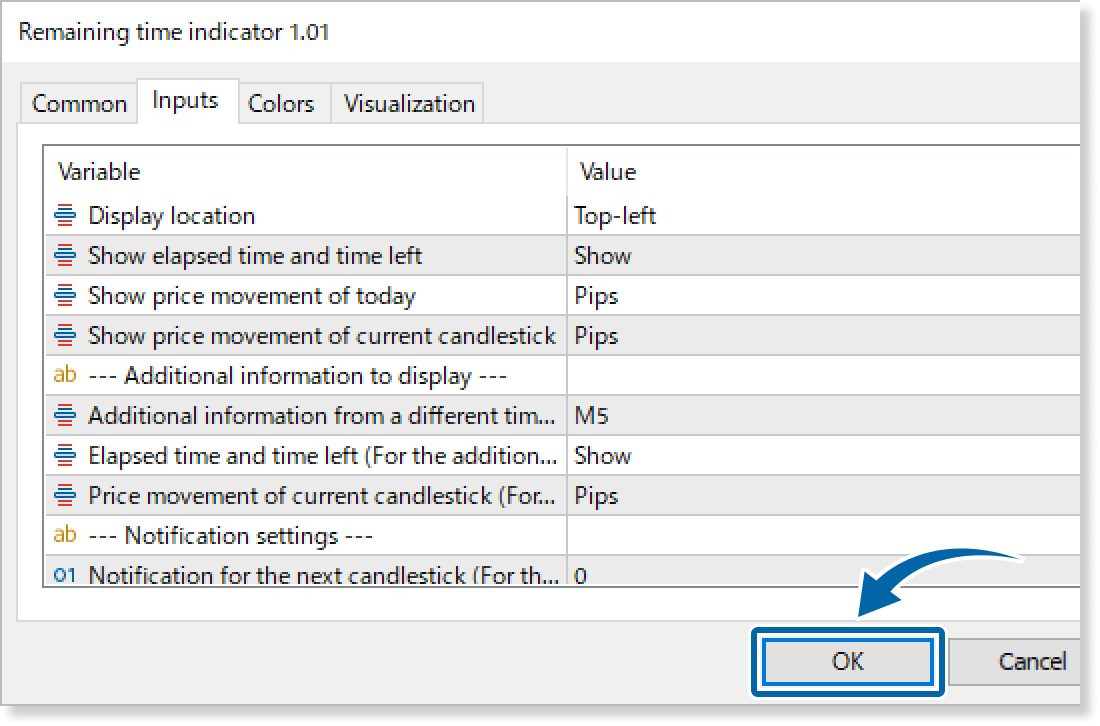
In the indicator settings window, customize the settings on the Inputs tab according to the How to set up page, then click OK.
Step 9
The Remaining Time Indicator is applied to the chart, and data will be displayed.
How to set up
Apply this indicator to the chart, then set the parameters according to your style.
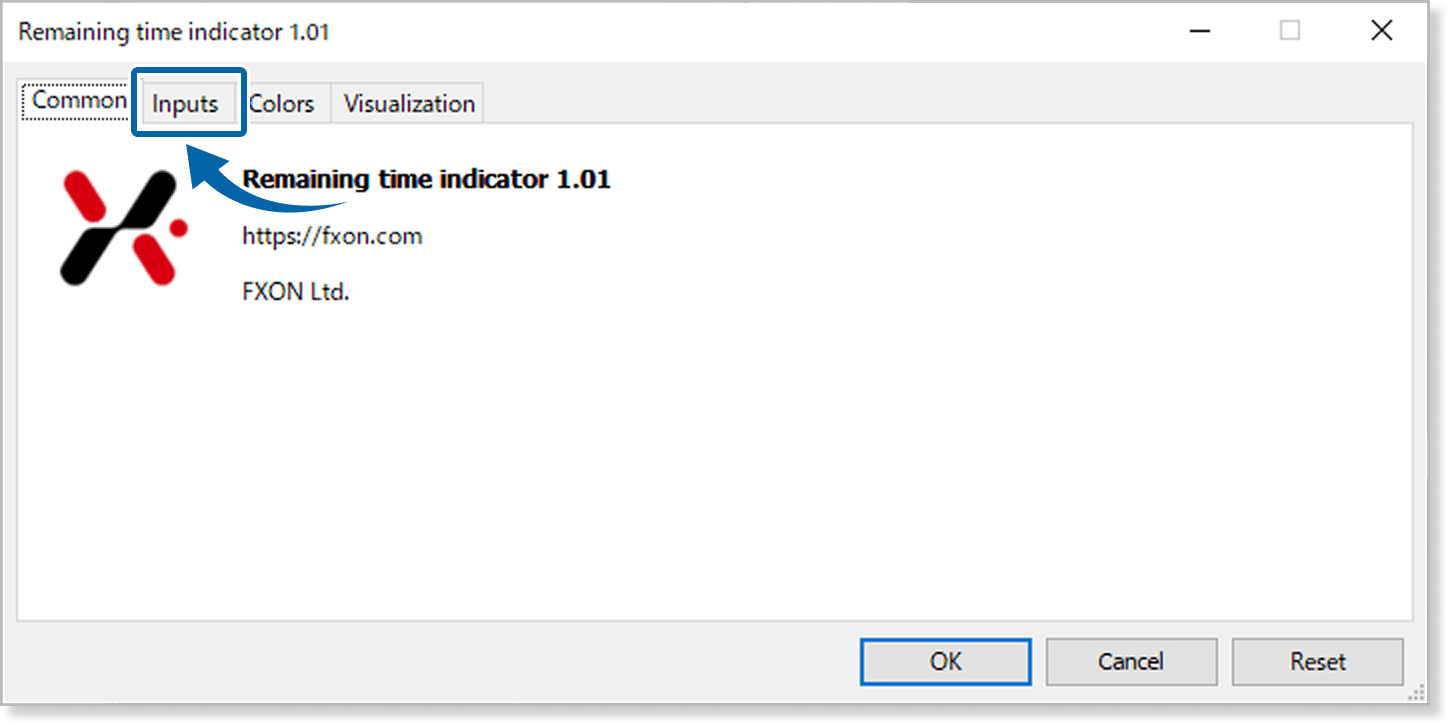
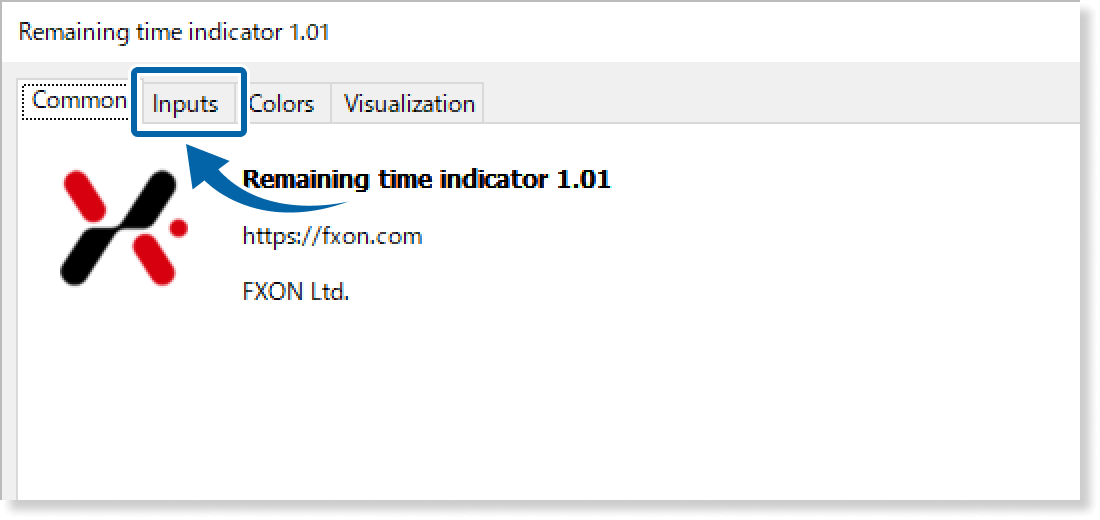
Step 1
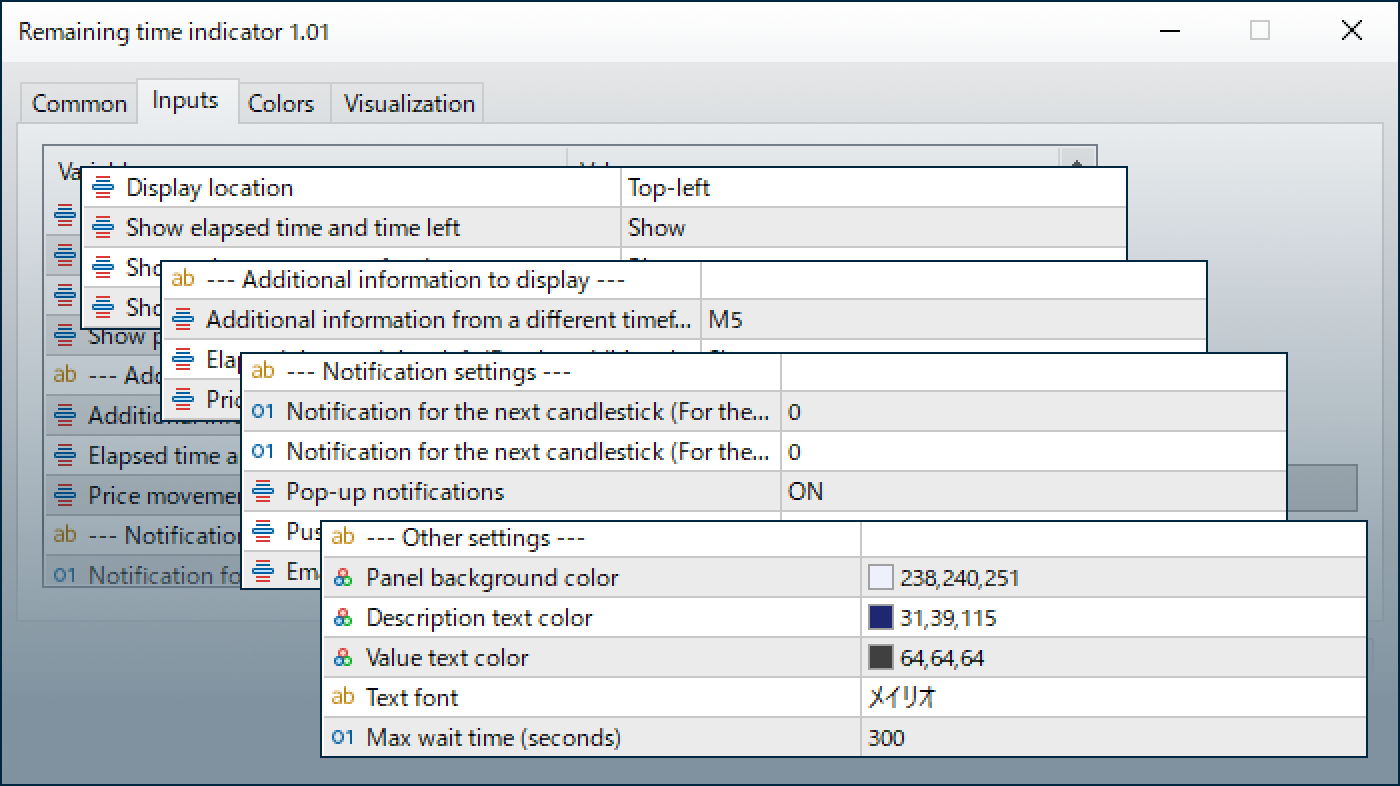
First, open the Inputs tab.
Step 2
Set the parameters as follows.
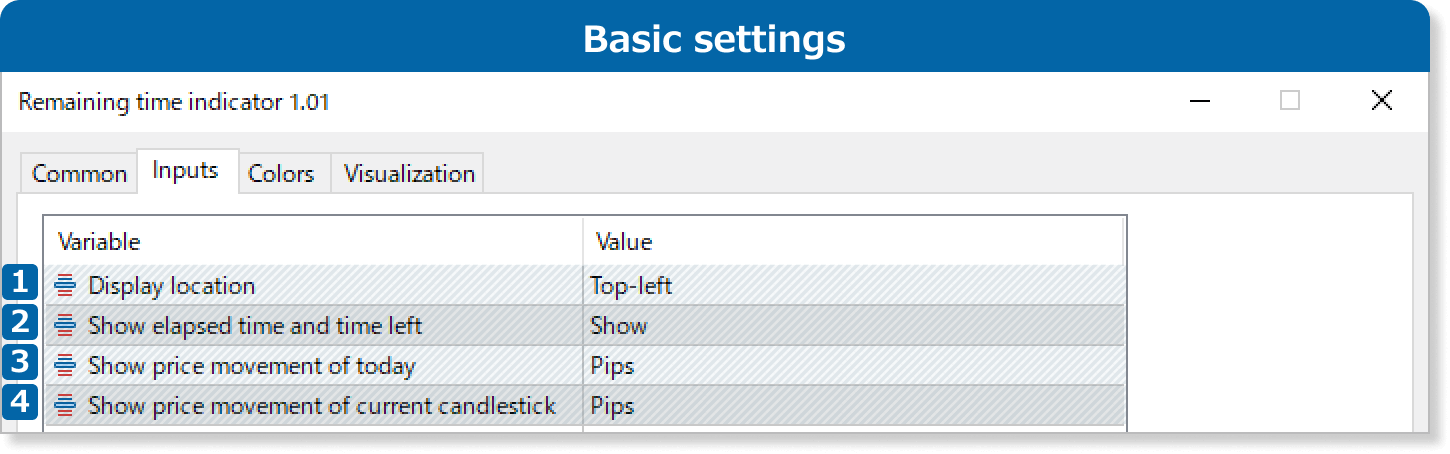
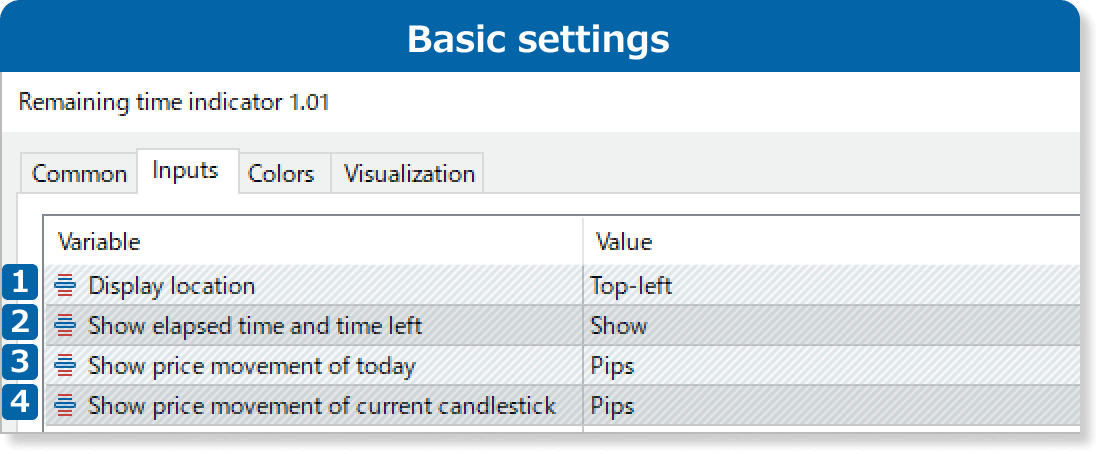
①Display location
Select the position: Top-left, Bottom-left, Top-right, or Bottom-right.
②Show elapsed time and time left
Show/hide the elapsed time and remaining time of the current bar.
③Show price movement of today
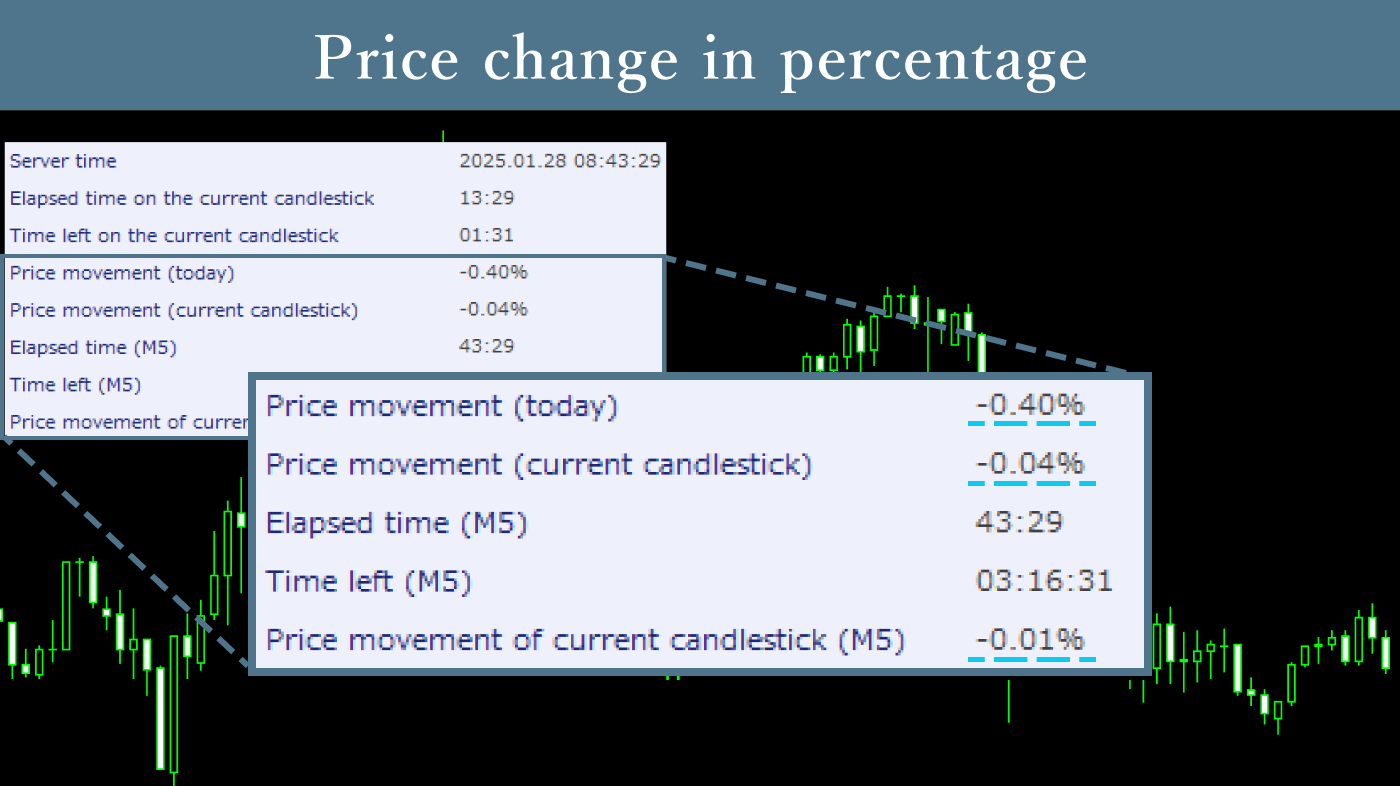
Show the price movement of the day in 'Pips' or 'Percentage', or 'Hide' it.
④Show price movement of current candlestick
Show the price movement of the current candlestick in 'Pips' or 'Percentage', or 'Hide' it.
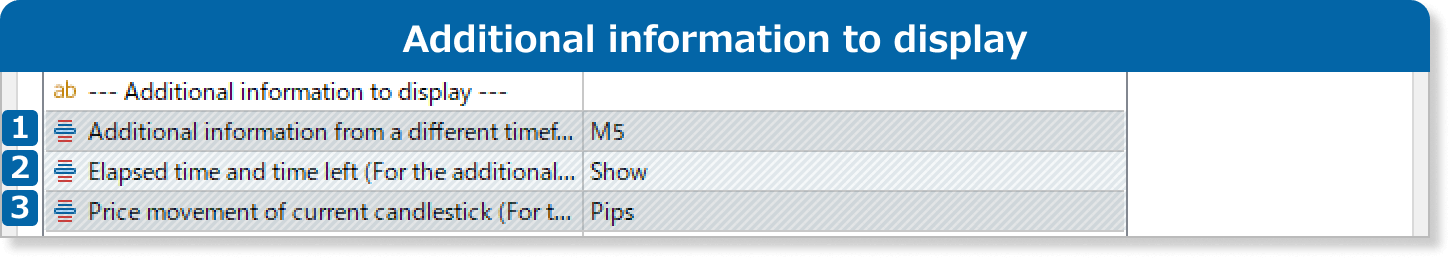
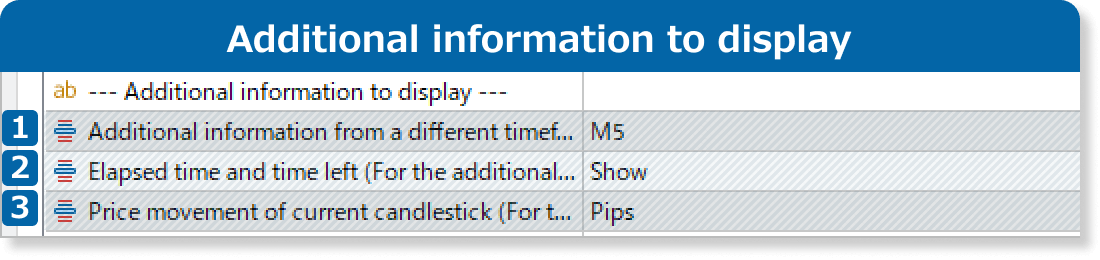
①Additional information from a different timeframe
To display data in a different timeframe than the chart, specify it here. Otherwise, select ‘Hide’.
②Elapsed time and time left (For the additional timeframe)
Show/hide the elapsed time and remaining time in the additional timeframe.
③Price movement of current candlestick
Show the price movement in the additional timeframe in 'Pips' or 'Percentage', or 'Hide' it.
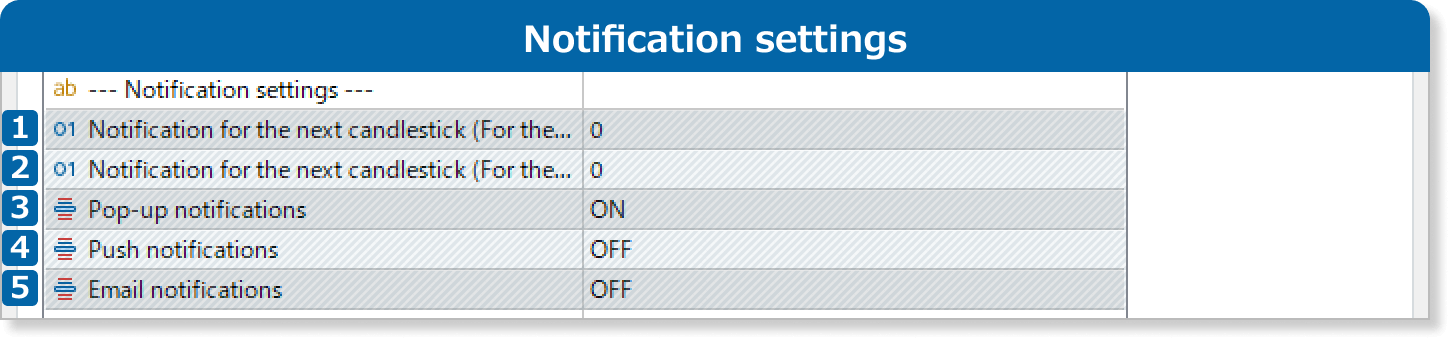
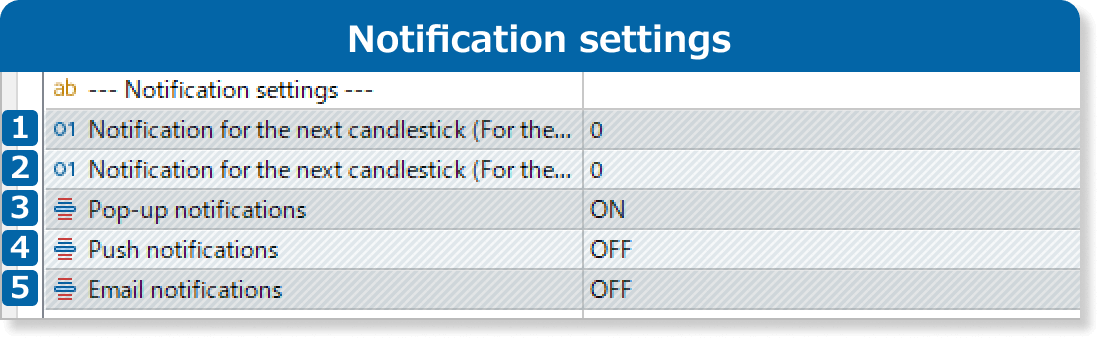
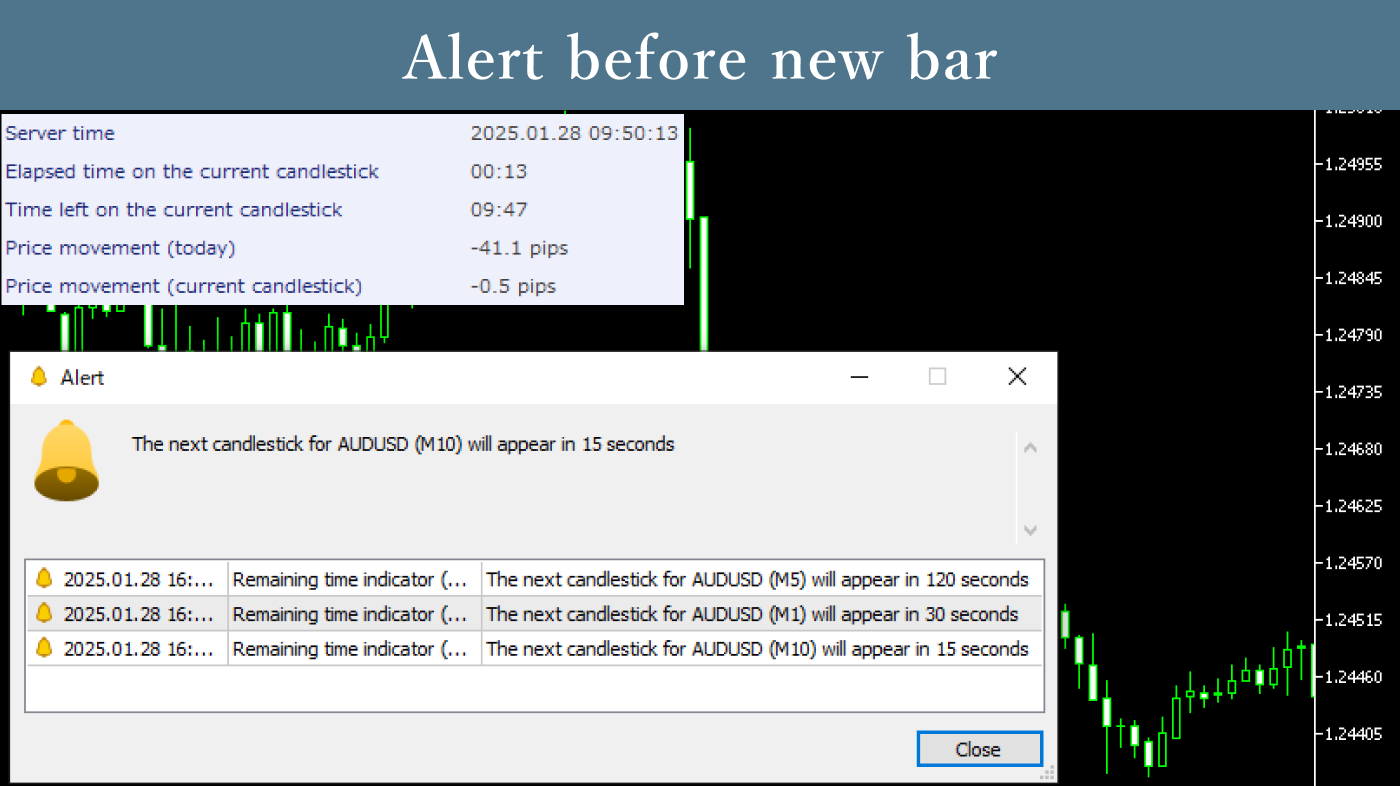
①Notification for the next candlestick (For the timeframe of the chart)
Set the number of seconds before the new bar appears to trigger the alert. For example, setting 60 will notify you 60 seconds before the new bar starts.
Notifications will be disabled if set to 0 or below.
②Notification for the next candlestick (For the additional timeframe)
For the timeframe specified in ‘Additional information from a different timeframe,’ set the number of seconds before the new bar appears to trigger the alert. For example, setting 60 will notify you 60 seconds before the new bar starts.
Notifications will be disabled if set to 0 or below, or if the ‘Additional information from a different timeframe’ option is set to ‘Hide.’.
③Pop-up notifications
When set to ON, you'll receive popup notifications on MT4/MT5 for PC.
④Push notifications
When set to ON, you'll receive popup notifications on the MT4/MT5 mobile app.
⑤Email notifications
When set to ON, you'll receive email notifications.
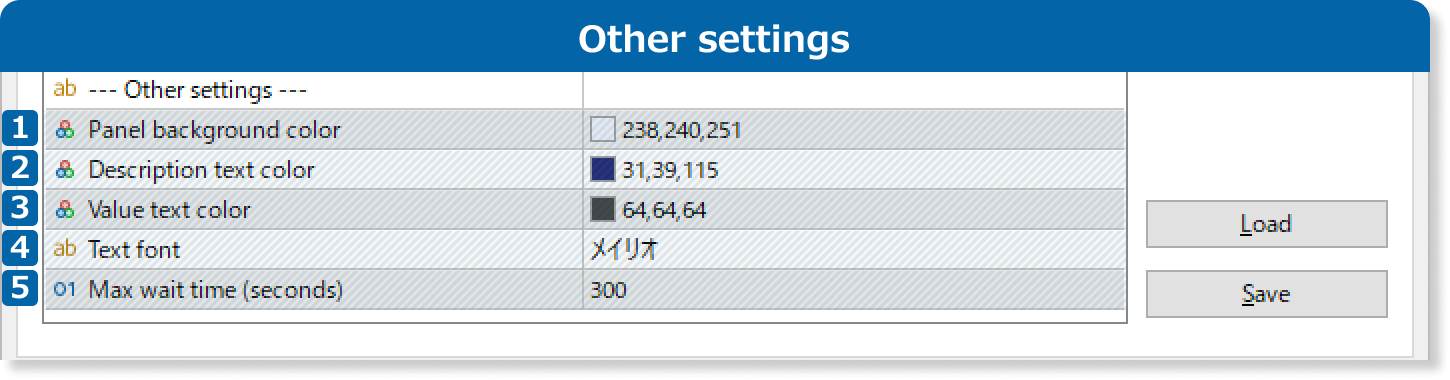
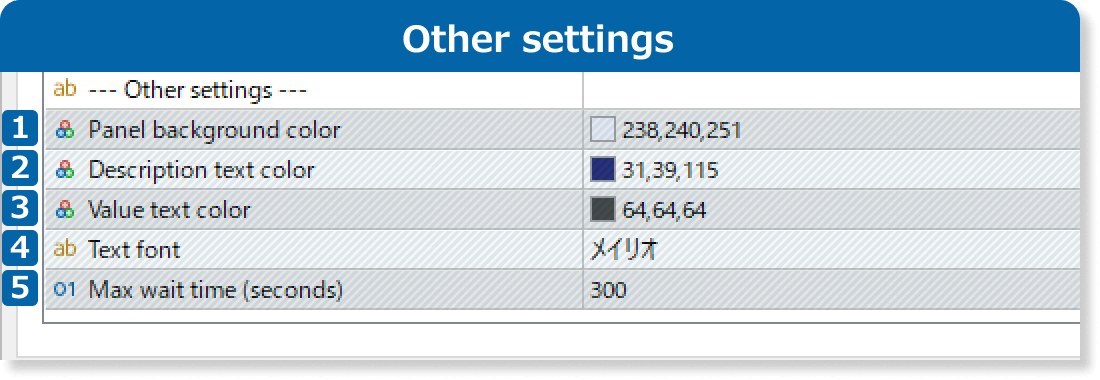
①Panel background color
Specify the color for the data panel on the chart.
②Description text color
Specify the font color for the data title, such as ‘Server time’ and ‘Elapsed time on the current candlestick’.
③Value text color
Specify the font color for the data, such as ‘00:50’ for ‘Elapsed time on the current candlestick’.
④Text font
Specify the font. The default is set to ‘Meiryo (メイリオ)’.
⑤Max wait time (seconds)
If no tick data is received within the specified seconds, an error message will appear on the chart.