2026.03.12 NEW
This article was :
published
updated
Recap of previous trading day (March 11)
Yesterday the USDJPY hit a low of 157.86 shortly after GMT 07:30, after which dollar buying intensified on news of a British vessel being attacked in the Strait of Hormuz, with the pair reaching a high of 158.97 shortly after GMT 16:30. Trading for the day closed at 158.82 yen.
Recap of the Tokyo market and outlook going forward
Today the USDJPY has seen continued yen selling and dollar buying, as attacks on oil infrastructure in the Middle East persist and the Strait of Hormuz remains closed. The pair reached a high of 159.23 shortly after GMT 00:00, and as of GMT 04:00 has pulled back to the 159.0-yen range.
Looking at the 1-hour chart of the USDJPY (as of GMT 04:00 on March 12), price action has lacked clear direction since hitting the 159.23 high. A break below the 158.77 area would likely shift the near-term bias to the downside, but the market is watching closely whether the pair can push through the recent high.
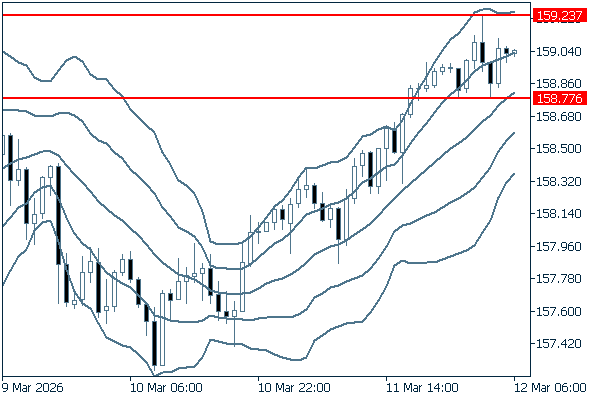
(20-period Bollinger Band, showing ±1 and ±2 standard deviations)
The main economic indicators for today are as follows:
- GMT 12:30 U.S. January Trade balance
- GMT 12:30 U.S. Initial jobless claims for the previous week
- GMT 12:30 U.S. Continuing jobless claims for the previous week
- GMT 13:30 U.S. January Housing starts
Don't miss trade opportunities with a 99.9% execution rate.
Was this article helpful?
0 out of 0 people found this article helpful.
Thank you for your feedback.
Send