2026.03.10 NEW
This article was :
published
updated
Recap of previous trading day (March 9)
Yesterday the USDJPY saw sustained dollar buying amid rising tensions in the Middle East, reaching a high of 158.89 shortly after GMT 02:30. However, reports that President Trump was considering policies to cap rising oil prices -- along with news of a coordinated release of petroleum reserves by the G7 -- sent crude prices lower, pulling the USDJPY down with them. The USDJPY hit a low of 157.61 at around GMT 20:00 and closed at that level.
Recap of the Tokyo market and outlook going forward
Today the USDJPY has come under pressure as growing expectations of an early end to the conflict between the U.S. and Iran weigh on dollar demand. A low of 157.53 was reached around GMT 00:00, but the pair bounced without extending further to the downside. As of GMT 04:00, the USDJPY is trading around 157.80.
Looking at the 1-hour chart of the USDJPY (as of GMT 04:00 on March 10), the middle line is trending downward, though the decline appears to have stalled around 157.53. A break below that level would likely invite further selling pressure, while a move above 158.41 could signal a return to the upside trend.
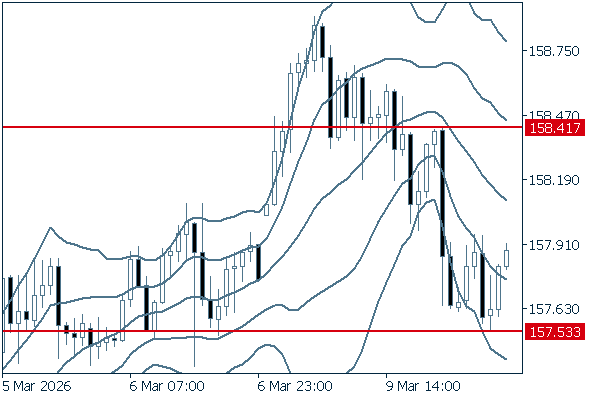
(20-period Bollinger Band, showing ±1 and ±2 standard deviations)
The main economic indicators for today are as follows:
- GMT 14:00 U.S. February Existing home sales
Don't miss trade opportunities with a 99.9% execution rate.
Was this article helpful?
0 out of 0 people found this article helpful.
Thank you for your feedback.
Send