


2026.03.05
This article was :
published
updated
Recap of previous trading day (March 4)
Yesterday the USDJPY reached a high of 157.87 shortly after GMT 00:00, but remained weak throughout the session. The pair found a floor at a low of 156.85 shortly after GMT 10:00, though upside remained capped. Trading for the day closed at 157.03 yen.
Recap of the Tokyo market and outlook going forward
Today the USDJPY hit a low of 156.45 shortly after GMT 01:00 before rebounding, climbing back into the 157-yen range around GMT 04:00. Armed conflict in the Middle East has driven oil prices higher, with New York crude up more than 3%, providing support for the dollar.
Looking at the 1-hour chart of the USDJPY (as of GMT 04:10 on March 5), the pair has broken below the -2 standard deviation band before returning inside the Bollinger Band and reaching the middle line. Pressure to sell on rallies remains a factor at current levels, but a break above 157.46, which would be near the +2 standard deviation band, would warrant a shift to a bullish outlook.
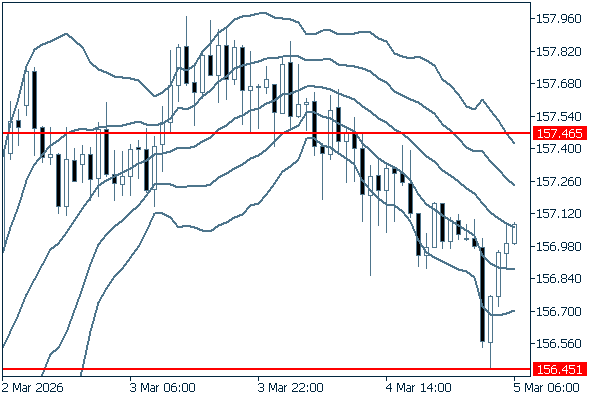
(20-period Bollinger Band, showing ±1 and ±2 standard deviations)
The main economic indicators for today are as follows:
- GMT 13:30 U.S. Initial jobless claims for the previous week
- GMT 13:30 U.S. Continuing jobless claims for the previous week
Don't miss trade opportunities with a 99.9% execution rate.
Was this article helpful?
0 out of 0 people found this article helpful.
Thank you for your feedback.
Send