


2026.03.02
This article was :
published
updated
Recap of previous trading day (February 27)
On Friday of last week the USDJPY fell to a low of 155.53, hit shortly after GMT 04:00, as selling pressure mounted amid the intensifying standoff between the Trump administration and U.S. private-sector companies, along with a decline in the President's approval ratings. It subsequently rebounded and traded sideways in the lower 156-yen range. Trading for the week closed at 156.05 yen.
Recap of the Tokyo market and outlook going forward
Today the USDJPY has seen moderate dollar buying pressure amid the ongoing turmoil in the Middle East. The pair reached a high of 156.80 shortly after GMT 00:00 before pulling back, though as of GMT 05:00 it has recovered to the 156.6-yen range once again.
Looking at the 1-hour chart of the USDJPY (as of GMT 05:20 on March 2), the pair is closing in on the February 24 high of 156.82. A break above that level and through 157 would likely open the door to further upside.
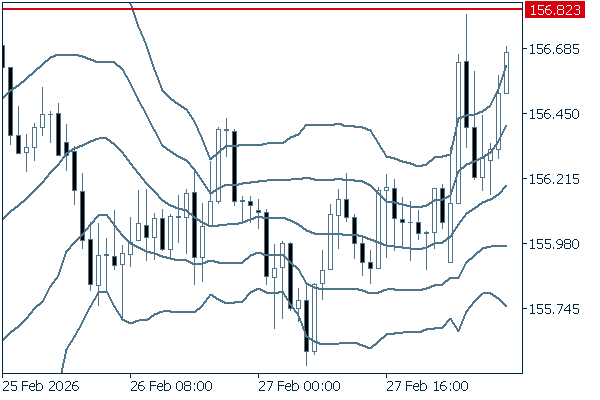
(20-period Bollinger Band, showing ±1 and ±2 standard deviations)
The main economic indicators for today are as follows:
- GMT 14:45 U.S. February Manufacturing Purchasing Managers Index (PMI, revised)
- GMT 15:00 U.S. February ISM Manufacturing PMI
Don't miss trade opportunities with a 99.9% execution rate.
Was this article helpful?
0 out of 0 people found this article helpful.
Thank you for your feedback.
Send