2026.02.23
This article was :
published
updated
Recap of previous trading day (February 20)
On Friday of last week the USDJPY held firm, reaching a high of 155.64 shortly after GMT 09:00, but turned lower after the U.S. Supreme Court ruled against upholding the Trump administration's tariffs, falling to a low of 154.71 shortly after GMT 16:00. The decline then stabilized, and trading for the day closed at 155.00 yen.
Recap of the Tokyo market and outlook going forward
Today the USDJPY came under selling pressure amid growing uncertainty over the Trump administration's policy direction, with the Tokyo market closed, falling to a low of 153.99 yen shortly after GMT 01:00. As of GMT 04:30, the decline has steadied and the pair has recovered to around 154.4 yen.
Looking at the 1-hour chart of the USDJPY (as of GMT 04:40 on February 23), the pair has dropped sharply before returning within the band after reaching 154.0 yen, suggesting the market is wary of selling into any rebound. If the pair breaks below 154 yen again, the next target looks to be around the 153.5-yen range.
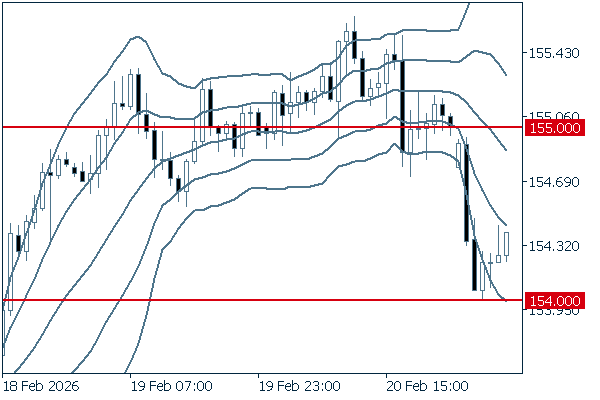
(20-period Bollinger Band, showing ±1 and ±2 standard deviations)
The main economic indicators for today are as follows:
- GMT 15:00 U.S. December Factory Orders
Don't miss trade opportunities with a 99.9% execution rate.
Was this article helpful?
0 out of 0 people found this article helpful.
Thank you for your feedback.
Send