


2026.02.06
This article was :
published
updated
Recap of previous trading day (February 5)
Yesterday the USDJPY traded sideways in the upper 156-yen range during the Tokyo session, but broke above 157 around GMT 06:00 and held firm, reaching a high of 157.33 yen around GMT 09:30. Intervention fears then triggered a pullback, with the pair hitting a low of 156.53 around GMT 13:30, before rebounding. Trading for the day closed at 157.00 yen.
Recap of the Tokyo market and outlook going forward
Today the USDJPY touched 157.05 shortly after GMT 23:00 (on February 5), then turned lower and hit a low of 156.51 yen around GMT 01:30. Recovery attempts have been muted, with upside capped, and as of GMT 04:30 the pair is trading in the 156.6-yen range.
Looking at the 1-hour chart of the USDJPY (as of GMT 04:30 on February 6), the rally has paused and highs are trending lower, but on this timeframe the directional bias remains unclear. A break below 156.35 yen could lead to a short-term decline toward the 156.0-yen level.
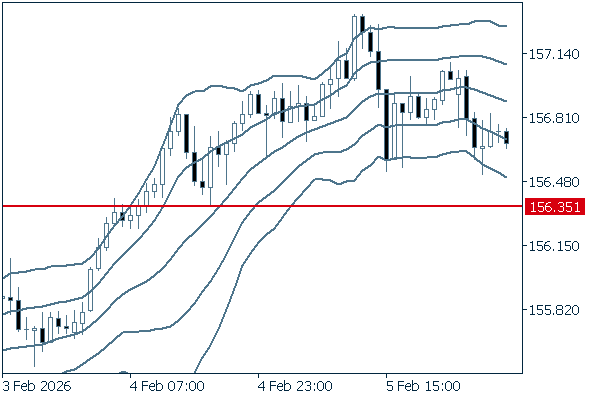
(20-period Bollinger Band, showing ±1 and ±2 standard deviations)
The main economic indicators for today are as follows:
- GMT 15:00 U.S. February Michigan Consumer Sentiment, preliminary
Don't miss trade opportunities with a 99.9% execution rate.
Was this article helpful?
0 out of 0 people found this article helpful.
Thank you for your feedback.
Send