


2025.11.25
This article was :
published
updated
Recap of previous trading day (November 24)
Yesterday the USDJPY started at a low of 156.30 yen and reached a high of 157.18 yen around GMT 15:00. It then quickly fell back and moved sideways in the upper 156-yen range, with trading for the day closing at 156.83 yen.
Recap of the Tokyo market and outlook going forward
As a so-called "5/10 day" (a date ending in "5" or on a multiple of "10" on which Japanese companies often settle foreign exchange payments), today the USDJPY reached a high of 156.98 shortly after GMT 00:30 before falling back. The decline halted at a low of 156.55 shortly after GMT 01:30, and as of GMT 05:00 is trading in the upper 156-yen range.
Looking at the 1-hour chart of the USDJPY (as of GMT 05:00 on November 25), the middle line is approaching horizontal, making it difficult to see a clear direction. If the price breaks substantially above 157.18, it would be reasonable to shift to a bullish outlook.
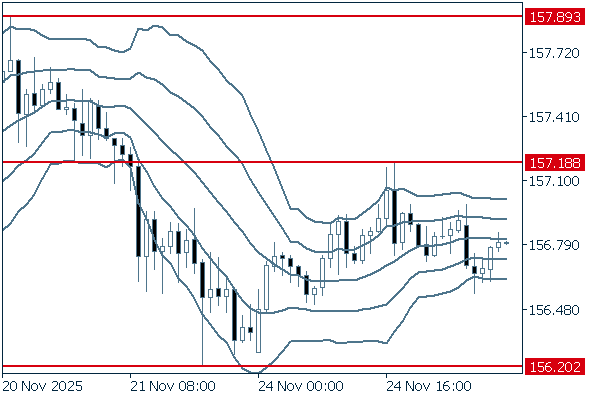
(20-period Bollinger Band, showing ±1 and ±2 standard deviations)
The main economic indicators for today are as follows:
- GMT 13:30 U.S. September Producer Price Index (PPI)
- GMT 13:30 U.S. September Producer Price Index (core PPI excluding food and energy)
- GMT 13:30 U.S. September Retail sales
- GMT 13:30 U.S. September Retail sales (excluding autos)
Don't miss trade opportunities with a 99.9% execution rate.
Was this article helpful?
0 out of 0 people found this article helpful.
Thank you for your feedback.
Send