


2025.11.14
This article was :
published
updated
Recap of previous trading day (November 13)
Yesterday the USDJPY reached a high of 155.01 shortly after GMT 01:00, and continued testing highs before peaking at 155.0 around GMT 05:30, then reversed lower. The pair hit a low of 154.12 shortly after GMT 15:30, then rebounded. Trading for the day closed at 154.52 with no clear direction.
Recap of the Tokyo market and outlook going forward
Today the USDJPY came under pressure from the sharp decline in the Nikkei Stock Average following the previous day's U.S. stock market selloff, reaching a high of 154.74 around GMT 00:00 before reversing lower and hitting a low of 154.31 around GMT 03:30. As of GMT 04:30, it is trading in the mid-154-yen range.
Looking at the 1-hour chart of the USDJPY (as of GMT 04:20 on November 14), selling pressure has been intensifying from the 155-yen level, and the middle line is starting to turn downward on this timeframe. If it breaks below 154.12, the corrective decline is likely to continue further.
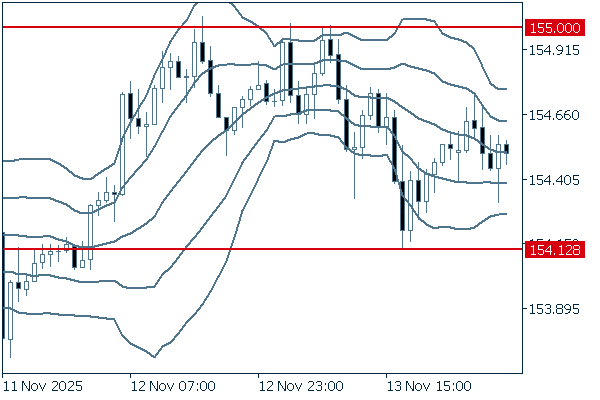
(20-period Bollinger Band, showing ±1 and ±2 standard deviations)
Today, no closely watched economic indicators are scheduled for release.
Don't miss trade opportunities with a 99.9% execution rate.
Was this article helpful?
0 out of 0 people found this article helpful.
Thank you for your feedback.
Send