


2025.10.23
This article was :
published
updated
Recap of previous trading day (October 22)
Yesterday the USDJPY hit a low of 151.48 around GMT 01:00, then moved up and down without clear direction before reaching a high of 152.04 shortly after GMT 13:00.
Reports emerged that the Trump administration is considering export restrictions to China across a wide range of critical software sectors, causing a brief drop to around the 151.50 level, but the decline was short-lived, and trading for the day closed at 151.96.
Recap of the Tokyo market and outlook going forward
Today the USDJPY has traded firmly since hitting a low of 151.82 shortly after GMT 22:00 (on October 22), reaching a high of 152.57 around GMT 04:00. However, the rally has not continued, and as of GMT 05:00, the pair is trading sideways in the lower 152-yen range.
Looking at the 1-hour chart of the USDJPY (as of GMT 05:20 on October 23), the pair has risen from consolidation and is now in an upward trend on the current timeframe. If it continues to make new highs, a bullish outlook appears appropriate.
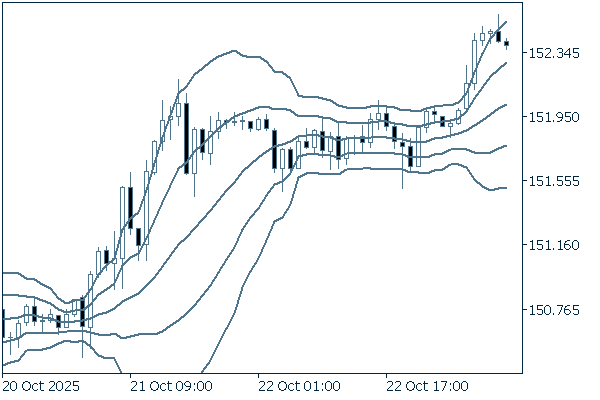
(20-period Bollinger Band, showing ±1 and ±2 standard deviations)
The main economic indicators for today are as follows:
- GMT 14:00 U.S. September Existing home sales
Don't miss trade opportunities with a 99.9% execution rate.
Was this article helpful?
0 out of 0 people found this article helpful.
Thank you for your feedback.
Send