


2025.08.12
This article was :
published
updated
Recap of previous trading day (August 11)
Yesterday the USDJPY declined gradually from the opening, but after hitting a low of 147.35 around GMT 08:00, it moved steadily higher, reaching a high of 148.25 around GMT 20:00, and trading for the day closed at 148.18 yen.
Recap of the Tokyo market and outlook going forward
Today the USDJPY continued its steady upward momentum from the previous day, hitting a high of 148.44 shortly after GMT 03:30.
Looking at the 1-hour chart of the USDJPY (as of GMT 04:30 on August 12), the middle line is trending upward and the upward Bollinger Band walk continues. If the price clearly breaks above 148.50, it looks likely to head straight toward 149 yen.
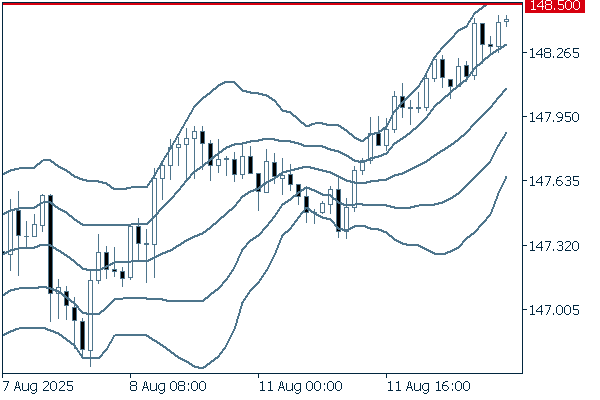
(20-period Bollinger Band, showing ±1 and ±2 standard deviations)
The main economic indicators for today are as follows:
- GMT 12:30 U.S. July Consumer Price Index (CPI)
- GMT 12:30 U.S. July Consumer Price Index (Core CPI)
- GMT 18:00 U.S. July Monthly Budget Statement
Don't miss trade opportunities with a 99.9% execution rate
Was this article helpful?
0 out of 0 people found this article helpful.
Thank you for your feedback.
Send