


2025.07.03
This article was :
published
updated
Recap of previous trading day (July 2)
Yesterday the USDJPY touched a low of 143.31 around GMT 00:00 and then traded firmly, reaching a high of 144.24 around GMT 09:30.
When the June ADP employment statistics were released at GMT 12:15, showing poor results, there was a temporary sharp decline, but buying soon returned, and trading for the day closed at 143.59 yen.
Recap of the Tokyo market and outlook going forward
Today the USDJPY touched a low of 143.44 around GMT 00:30 before turning upward, and as of GMT 04:00 is trading in the upper 143-yen range.
Looking at the 1-hour chart of the USDJPY (as of GMT 04:20 on July 3), the middle line is almost horizontal, indicating a situation where direction is difficult to discern. It could be said that this is a phase where it is preferable to wait until the price breaks either upward or downward.
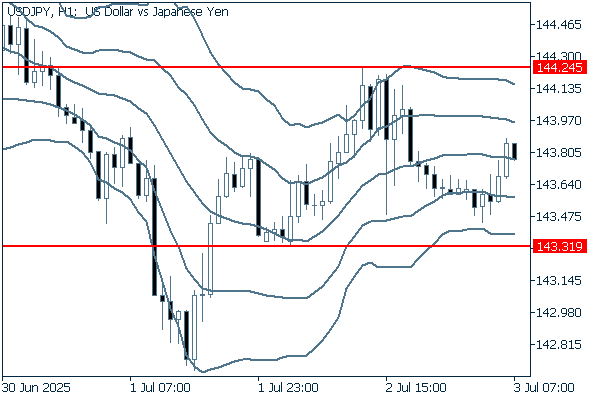
(20-period Bollinger Band, showing ±1 and ±2 standard deviations)
The main economic indicators for today are as follows:
- GMT 12:30 U.S. June Nonfarm payrolls
- GMT 12:30 U.S. June Unemployment rate
- GMT 12:30 U.S. June Average hourly earnings
- GMT 14:00 U.S. June ISM Services PMI
Don't miss trade opportunities with a 99.9% execution rate
Was this article helpful?
0 out of 0 people found this article helpful.
Thank you for your feedback.
Send