


2025.06.02
This article was :
published
updated
Recap of previous trading day (May 30)
On Friday of last week the USDJPY consolidated around the 144.0-yen level. It hit a low of 143.43 yen shortly after GMT 01:00 (previous day) and temporarily rebounded. It reached a high of 144.44 yen shortly after GMT 14:30 but then fell back, and trading for the day closed at 144.00 yen.
Recap of the Tokyo market and outlook going forward
Today, amid caution over Trump tariff risks and U.S.-China confrontation, the USDJPY declined from a high of 143.98 yen reached around GMT 22:30 (on June 1), hitting a low of 143.32 yen shortly after GMT 01:30. As of GMT 04:00, it is trading in the upper 143-yen range.
Looking at the 1-hour chart of the USDJPY (as of GMT 04:30 on June 2), after moving sideways, the price is trading below -1 standard deviation. Unless it clearly breaks above the middle line, it seems appropriate to maintain a downward outlook.
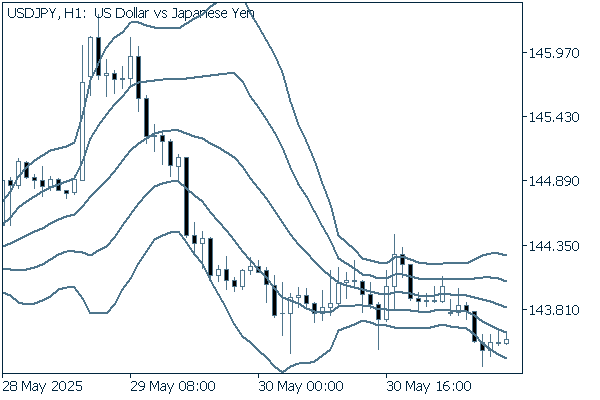
(20-period Bollinger Band, showing ±1 and ±2 standard deviations)
The main economic indicators for today are as follows:
- GMT 13:45 U.S. May Manufacturing Purchasing Managers Index (PMI, revised)
- GMT 14:00 U.S. May ISM Manufacturing PMI
- GMT 17:00 U.S. Statements from FRB Chairman Jerome Powell
Don't miss trade opportunities with a 99.9% execution rate
Was this article helpful?
0 out of 0 people found this article helpful.
Thank you for your feedback.
Send