


2025.05.16
This article was :
published
updated
Recap of previous trading day (May 15)
Yesterday the USDJPY reached a high of 146.75 yen shortly after GMT 00:00 before declining, falling below 146 yen around GMT 03:30.
Multiple U.S. economic indicators were released around GMT 12:30, but after fluctuating up and down, no clear direction emerged, and trading for the day closed at 145.65 yen.
Recap of the Tokyo market and outlook going forward
Today the USDJPY reached a high of 145.68 yen shortly after GMT 23:30 (on May 15) before declining, touching a low of 144.96 yen around GMT 01:00. As of GMT 05:00, the decline has paused, and the price is moving in the lower 145-yen range.
Looking at the 1-hour chart of the USDJPY (as of GMT 05:00 on May 16), the middle line is sloping downward, forming a downward band walk. If it falls below 145 yen again, the downward trend is likely to continue.
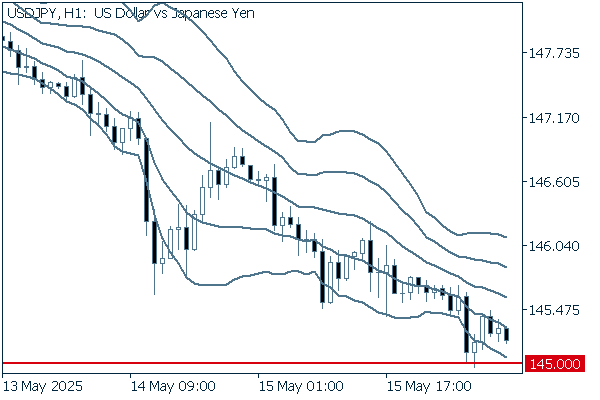
(20-period Bollinger Band, showing ±1 and ±2 standard deviations)
The main economic indicators for today are as follows:
- GMT 12:30 U.S. April Housing starts
- GMT 12:30 U.S. April Building permits
- GMT 14:00 U.S. May Michigan Consumer Sentiment, preliminary
- GMT 20:00 U.S. March Total net TIC flows
Don't miss trade opportunities with a 99.9% execution rate
Was this article helpful?
0 out of 0 people found this article helpful.
Thank you for your feedback.
Send