


2025.05.06
This article was :
published
updated
Recap of previous trading day (May 5)
Yesterday the USDJPY reached a high of 144.99 yen shortly after GMT 22:00, but then lost momentum. Shortly after GMT 01:00, the price was moving within the lower 144-yen range, but then declined further, reaching a low of 143.54 yen shortly after GMT 13:30.
The U.S. April ISM Non-Manufacturing Index was released shortly after GMT 14:00, showing good figures that prompted buying, but it subsequently fell back, and trading for the day closed at 143.68 yen.
Recap of the Tokyo market and outlook going forward
Today the USDJPY reached a high of 144.27 yen shortly after GMT 01:30, but quickly reversed course and as of GMT 05:00, it is trending downward to around 143.7 yen.
Looking at the 1-hour chart of the USDJPY (as of GMT 05:00 on May 6), the band width has narrowed, indicating a movement close to consolidation. Due to strong selling pressure, the downward bias is apparent, and a break below yesterday's low seems likely.
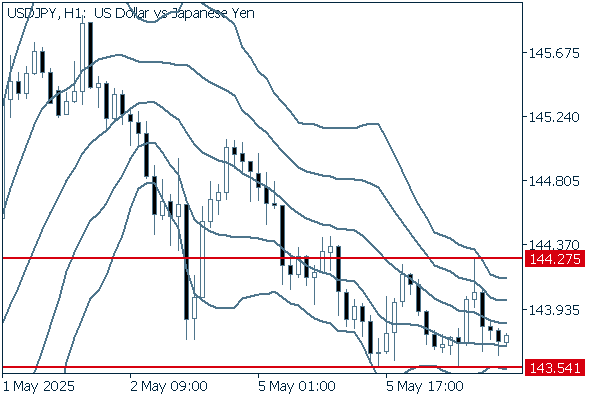
(20-period Bollinger Band, showing ±1 and ±2 standard deviations)
The main economic indicators for today are as follows:
- U.S. Federal Open Market Committee (FOMC) Day 1
- GMT 12:30 U.S. March Trade balance
Don't miss trade opportunities!
Was this article helpful?
0 out of 0 people found this article helpful.
Thank you for your feedback.
Send