


2025.04.30
This article was :
published
updated
Recap of previous trading day (April 29)
Yesterday the USDJPY reached a high of 142.75 yen around GMT 12:00, but then began to decline. The dollar weakened further after economic indicators for that day showed poor results. The price bottomed out at 141.97 yen shortly after GMT 16:00, and trading for the day closed at 142.27 yen.
Recap of the Tokyo market and outlook going forward
Today the USDJPY is trading somewhat firmly as of GMT 04:00, with dollar buying returning after President Trump's 100-day inauguration anniversary speech concluded without incident.
Looking at the 1-hour chart of the USDJPY (as of GMT 04:00 on April 30), we can see a sideways movement with contracted band width, suggesting potential breakout in either direction. It would be advisable to follow the direction once it breaks through key levels.
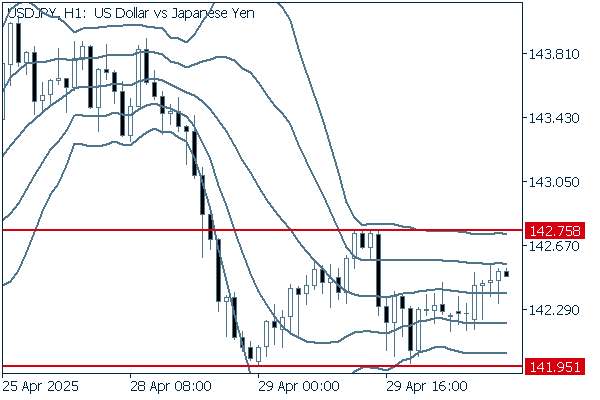
(20-period Bollinger Band, showing ±1 and ±2 standard deviations)
The main economic indicators for today are as follows:
- GMT 12:15 U.S. April ADP employment change
- GMT 12:30 U.S. Q1 Employment Cost Index
- GMT 12:30 U.S. Real gross domestic product (GDP), Q1 (preliminary)
- GMT 13:45 U.S. April Chicago Purchasing Managers Index
- GMT 14:00 U.S. March Personal Spending
Was this article helpful?
0 out of 0 people found this article helpful.
Thank you for your feedback.
Send