


2025.03.27
This article was :
published
updated
Recap of previous trading day (March 26)
Yesterday the USDJPY touched a low of 149.84 yen around GMT 00:00, then rose and reached the 150.6-yen range around GMT 05:00 before falling back. It then reached a high of 150.74 yen around GMT 13:15. However, the price rise then stalled, with trading for the day closing at 150.52.
Recap of the Tokyo market and outlook going forward
Today the USDJPY hit a high of 150.62 yen shortly after GMT 00:00, and as of GMT 04:00, it is trading in the lower 150-yen range.
Looking at the 1-hour chart of the USDJPY (as of GMT 04:30 on March 27), the middle line has become almost horizontal in the range from 150.0 yen to 150.75 yen, indicating a lack of momentum.
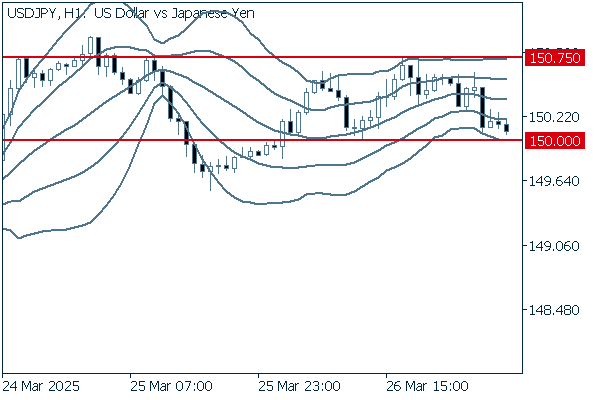
(20-period Bollinger Band, showing ±1 and ±2 standard deviations)
The main economic indicators for today are as follows:
- GMT 12:30 U.S. Real gross domestic product (GDP), Q4
- GMT 12:30 U.S. PCE Price Index, Q4
- GMT 12:30 U.S. Core PCE Price Index, Q4
- GMT 12:30 U.S. Initial jobless claims for the previous week
- GMT 12:30 U.S. Continuing jobless claims for the previous week
Was this article helpful?
0 out of 0 people found this article helpful.
Thank you for your feedback.
Send