


2025.02.03
This article was :
published
updated
Recap of previous trading day (January 31)
On Friday of last week the USDJPY touched a low of 153.91 around GMT 01:30, then rose to form a range in the upper 154 level. Subsequently, it reached a high of 155.22 around GMT 18:30, and trading for the week closed at 155.18.
Recap of the Tokyo market and outlook going forward
Today the USDJPY gapped down at the open at 154.74 yen, then filled the gap and rose. Trump's tariff policies are raising concerns about global trade friction, leading to dollar strength.
Around GMT 01:00, the USDJPY reached a high of 155.88, and as of GMT 04:00, it continues to trade in the upper 155 range.
Looking at the 1-hour chart of the USDJPY (as of GMT 03:50 on February 3), it is trading near +2 standard deviations and continues to rise. If it breaks above 156, which it couldn't surpass on January 28, it could rapidly extend to 158.
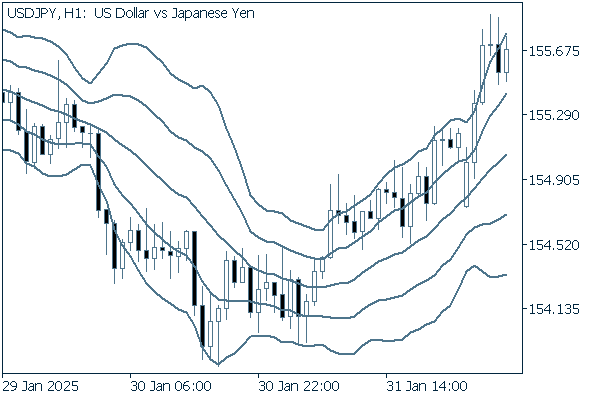
(20-period Bollinger Band, showing ±1 and ±2 standard deviations)
The main economic indicators for today are as follows:
- GMT 14:45 U.S. January Manufacturing Purchasing Managers Index (PMI)
- GMT 15:00 U.S. January ISM Manufacturing PMI
Was this article helpful?
0 out of 0 people found this article helpful.
Thank you for your feedback.
Send