


2024.12.02
This article was :
published
updated
Recap of previous trading day (November 29)
On Friday of last week the USDJPY started declining from its daily high of 151.54 reached directly after the open, and fell below 150 after GMT 01:00. Some time around GMT 18:00 the market hit a low of 149.46, and trading for the week closed at 149.71.
Recap of the Tokyo market and outlook going forward
Today the USDJPY began rising from its daily low of 149.48 seen directly after the open, following Trump's warning around GMT 22:00 (on December 1) about imposing 100% tariffs on BRICS nations. Shortly after GMT 03:00, the price hit a high of 150.74. As of GMT 04:00, it is trading in the mid 150-yen range.
Looking at the 1-hour chart of the USDJPY (as of GMT 03:50 December 2), it showed a significant rise from -2 standard deviations to +2 standard deviations, but the most recent candlestick has formed a long upper wick with a down bar. If the price breaks below the middle line around 150 yen, there is a possibility that the downward trend will continue.
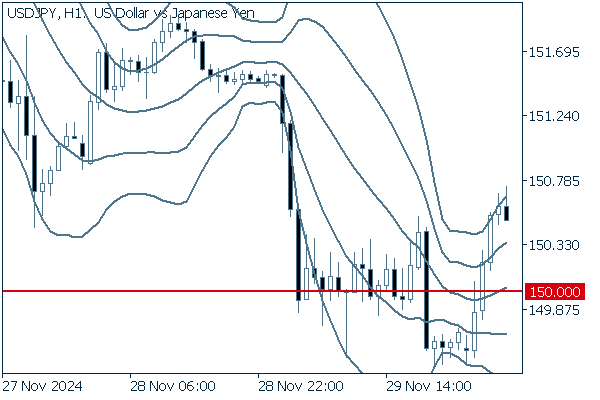
(20-period Bollinger Band, showing ±1 and ±2 standard deviations)
Today's main economic indicators are as follows.
- GMT 14:45 U.S. November Manufacturing Purchasing Managers Index
- GMT 15:00 U.S. November ISM Manufacturing PMI
Was this article helpful?
0 out of 0 people found this article helpful.
Thank you for your feedback.
Send