


2024.11.26
This article was :
published
updated
Recap of previous trading day (November 25)
Yesterday the USDJPY hit a low of 153.55 at around GMT 02:30, then turned upward and recorded a high of 154.72 after GMT 08:30. Subsequently, trading moved into a range-bound pattern, and trading for the day closed at 154.16.
Recap of the Tokyo market and outlook going forward
Today the USDJPY recorded a high of 154.49 after GMT 23:30 in response to Trump's comments about imposing tariffs on China, Mexico, and Canada. As of GMT 04:00, it is trading in the lower 153-yen range.
Looking at the 1-hour chart of the USDJPY (as of GMT 04:00 on November 26) the middle line is trending downward. If the price breaks below 153.55, it is expected to continue on a downward trend.
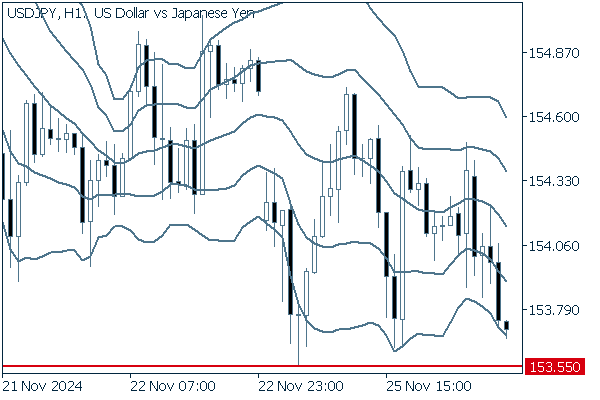
(20-period Bollinger Band, showing ±1 and ±2 standard deviations)
The main economic indicators for today are as follows:
- GMT 14:00 U.S. September Case-Shiller home price index
- GMT 15:00 U.S. October New home sales
- GMT 15:00 U.S. November Consumer Confidence Index
- GMT 15:00 U.S. November Richmond Fed manufacturing index
- GMT 19:00 U.S. Federal Open Market Committee (FOMC) Meeting Minutes
Was this article helpful?
0 out of 0 people found this article helpful.
Thank you for your feedback.
Send