


2024.11.14
This article was :
published
updated
Recap of previous trading day (November 13)
Yesterday the USDJPY fell directly after the open, then rose, reaching 155.23 around GMT 08:30, before turning downward.
The U.S. October Consumer Price Index, released at GMT 13:30, was in line with expectations, triggering dollar selling in the market. The USDJPY hit a low of 154.33 around GMT 14:00 before rising again. Trading ended at 155.45.
Recap of the Tokyo market and outlook going forward
Today the USDJPY began to rise at around GMT 00:00, reaching 156.06 just after GMT 02:30, before falling back. After GMT 04:00, it again exceeded 156 yen and continues to rise.
Looking at the 1-hour chart of the USDJPY (as of GMT 04:00 November 14), the price is moving between the +2 and +1 standard deviation Bollinger Bands, maintaining an upward trend.
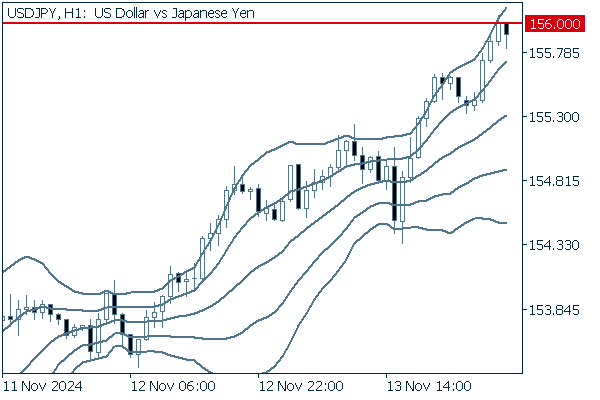
(20-period Bollinger Band, showing ±1 and ±2 standard deviations)
The main economic indicators for today are as follows:
- GMT 13:30 U.S. October Producer Price Index (PPI)
- GMT 13:30 U.S. October Producer Price Index (core PPI excluding food and energy)
- GMT 13:30 U.S. Initial jobless claims for the previous week
- GMT 13:30 U.S. Continuing jobless claims for the previous week
Was this article helpful?
0 out of 0 people found this article helpful.
Thank you for your feedback.
Send