


2024.10.23
This article was :
published
updated
Recap of previous trading day (October 22)
Yesterday the USDJPY trended downward in the early stages of the Tokyo session, but after marking a low of 150.49 shortly after GMT 01:00 the market began to rise, and broke above 151 yen not long after GMT 04:00. However, it was unable to move higher and trading was subsequently confined mainly to the upper half of the 150-yen range.
Shortly after GMT 14:00, during the New York session, the USDJPY again moved above 151 yen, and a little while after GMT 16:00 it set a high of 151.19. After reaching this new high the price initially fell back, but the bulls continued their push, and trading for the day ended at 151.05 yen.
Recap of the Tokyo market and outlook going forward
Today the USDJPY broke above the high of the previous day some time after GMT 00:00 and gathered upward momentum, so that shortly after GMT 05:00 it was trading in the 152-yen range.
Looking at the 1-hour chart of the USDJPY (as of GMT 03:05 on October 23), today's upward trend in the price can be seen to have resulted in a widening of the bands that had begun to tighten.
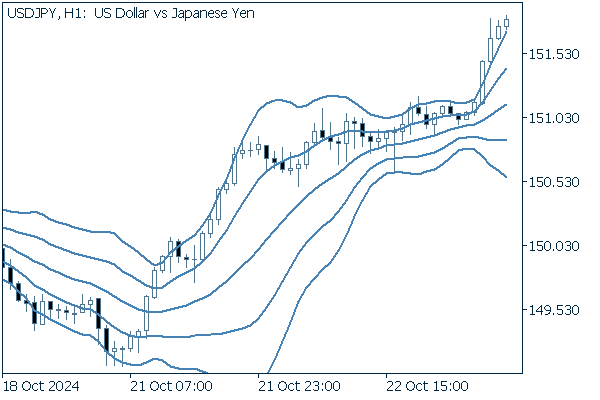
(20-period Bollinger Band, showing ±1 and ±2 standard deviations)
Today's main economic indicators are as follows.
- GMT 14:00 U.S. September Existing home sales
- GMT 18:00 U.S. Regional FRB economic reports (Beige Book)
Was this article helpful?
0 out of 0 people found this article helpful.
Thank you for your feedback.
Send