


2024.10.21
This article was :
published
updated
Recap of previous trading day (October 18)
After setting a high of 150.28 on Friday of last week at around GMT 23:30, the USDJPY then declined continuously from the lower end of the 150-yen range to the upper half of the 149-yen range as if being pushed down by the weight of the higher price.
Building permits for September in the U.S. that were announced at GMT 12:30 were poor both month on month and in terms of the seasonally adjusted annual rate. The market reacted by selling dollars, setting a low of 149.36 yen shortly after GMT 16:30, and trading for the week closed at 149.50.
Recap of the Tokyo market and outlook going forward
Today in the Tokyo session, falling below the level of the previous trading day and setting a new low of 149.08 not long after GMT 03:30.
Looking at the 1-hour chart of the USDJPY (as of GMT 05:00 on October 21), the middle line is trending down and the price itself is trading below that level, suggesting bearish sentiment going forward.
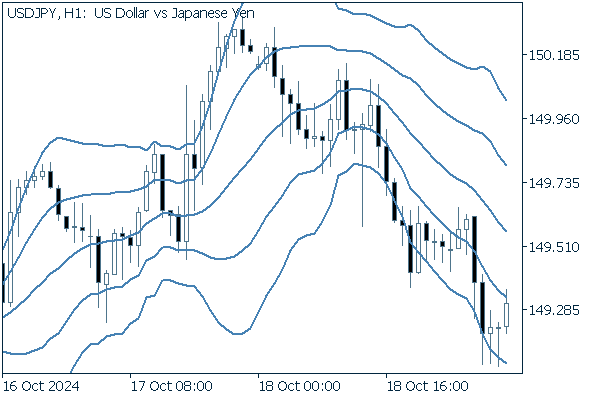
(20-period Bollinger Band, showing ±1 and ±2 standard deviations)
Today's main economic indicators are as follows.
- GMT 14:00 U.S. September Leading Index (MoM)
Was this article helpful?
0 out of 0 people found this article helpful.
Thank you for your feedback.
Send