


2024.06.07
This article was :
published
updated
Recap of previous trading day (June 6)
Yesterday the USDJPY recorded significant movement, both up and down. At around GMT 01:30 the yen touched a low of 155.35, but then reversed direction and by about GMT 13:00 had risen to reach a high of 156.44. However, this triggered a selloff and by late evening (GMT) the yen had hit a low of 155.47.
Recap of the Tokyo market and outlook going forward
Today the USDJPY lost momentum after hitting a high of 155.93 at around GMT 01:00, and by GMT 04:00 it was trading in the upper half of the 155-yen range.
Looking at the 1-hour chart of the USDJPY (as of GMT 04:05 on June 7), the upper and lower Bollinger Bands are separated from its center line by a roughly equal amount, indicating a range-bound market.
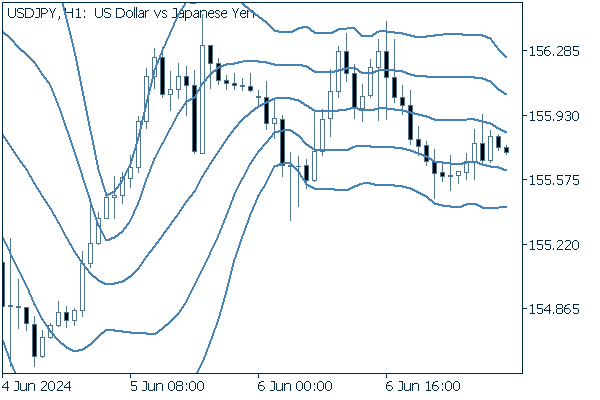
(20-period Bollinger Band, showing ±1 and ±2 standard deviations)
Today's main economic indicators are as follows.
- GMT 12:30 U.S. May Nonfarm payrolls (MoM)
- GMT 12:30 U.S. May Unemployment rate
- GMT 12:30 U.S. May Average hourly earnings (MoM)
- GMT 12:30 U.S. May Average hourly earnings (YoY)
Between now and the employment statistics, price movements may well lack force.
Was this article helpful?
0 out of 0 people found this article helpful.
Thank you for your feedback.
Send