


2024.06.05
This article was :
published
updated
Recap of previous trading day (June 4)
Price movement in the USDJPY yesterday had the same sort of rhythm as that of the day before yesterday. After marking a high of 156.48 at around GMT 01:30, the price continued to fall, and hit a low of 154.55 some time after GMT 14:00.
JOLTS Job Openings for the U.S. in April that were announced yesterday came in at 8.059 million, compared to a forecast of 8.355 million. The previous figure also fell, and was a factor in the USDJPY hitting its low.
Recap of the Tokyo market and outlook going forward
Today the price began trending upward in the first half of the Tokyo session, setting a high of 155.59 at about GMT 03:00.
Looking at the 1-hour chart of the USDJPY (as of GMT 03:15 on June 5), the price continued to fall after touching the middle line of the Bollinger Band, and has now resumed walking along the lower band.
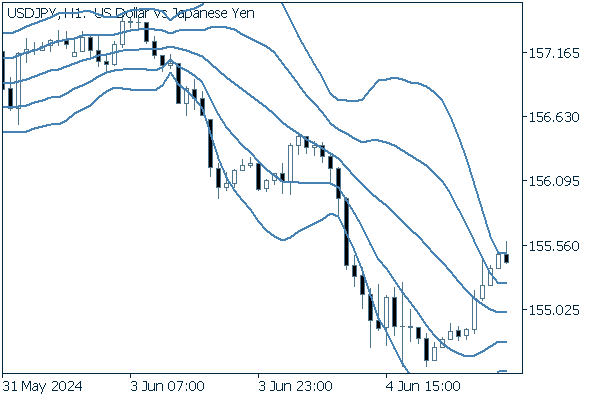
(20-period Bollinger Band, showing ±1 and ±2 standard deviations)
Today's main economic indicators are as follows.
- GMT 12:15 U.S. May ADP employment change (MoM)
- GMT 13:45 U.S. May Services Purchasing Managers Index (PMI, revised)
- GMT 13:45 U.S. May Composite Purchasing Managers Index (PMI, revised)
- GMT 14:00 U.S. May ISM Services PMI
Was this article helpful?
0 out of 0 people found this article helpful.
Thank you for your feedback.
Send