


2024.05.22
This article was :
published
updated
Recap of previous trading day (May 21)
Yesterday the USDJPY peaked at its high of 156.54 some time after GMT 04:00, then came off to mark a low of 155.94 just before GMT 15:00. With a difference between high and low of only 60 pips or so, it turned out to be a day without clear direction.
Recap of the Tokyo market and outlook going forward
Today the USDJPY opened at 156.14, and then rose gradually. Shortly after GMT 04:30, the price hit a high of 156.38.
A look at the 1-hour chart of the USDJPY (as of GMT 05:15 on May 22) shows that the upper-band walking that began after the price broke through resistance has faded, leaving a trendless market in its wake.
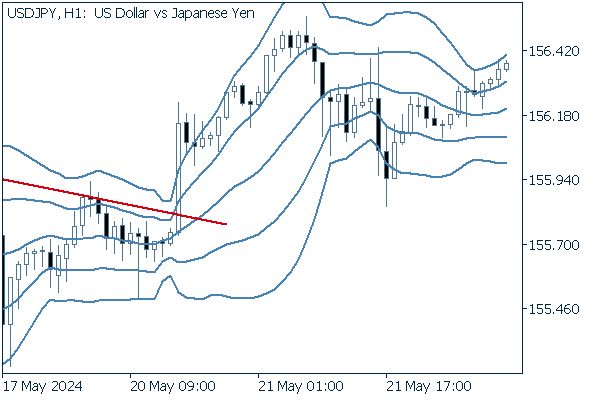
(20-period Bollinger Band, showing ±1 and ±2 standard deviations)
Today's main economic indicators are as follows.
- GMT 14:00 U.S. April Existing home sales (seasonally adjusted annual rate)
- GMT 14:00 U.S. April Existing home sales (MoM)
- GMT 18:00 U.S. Federal Open Market Committee (FOMC) Meeting Minutes
For the FOMC minutes, attention will be focused on whether they contain information that might give hints about monetary policy going forward.
Was this article helpful?
0 out of 0 people found this article helpful.
Thank you for your feedback.
Send